
Using Connected Vehicle Data to Save Lives
A project that looked at using CV data for traffic safety applications.
Last summer, I had the opportunity to work with some connected vehicle data (dated pre-COVID Feb. 2020) in San Antonio as part of a project with the Texas Department of Transportation (TxDOT).
The Intersection
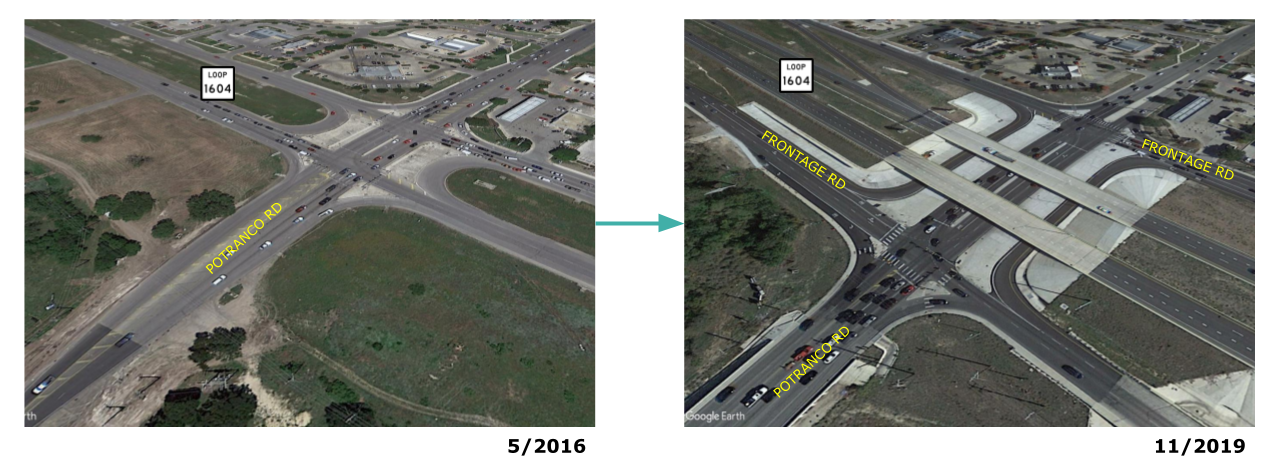
Loop 1604 at Potranco Road was recently converted from an at-grade signalized intersection to a typical Texas diamond overpass with frontage roads. Construction completed around the end of 2018.
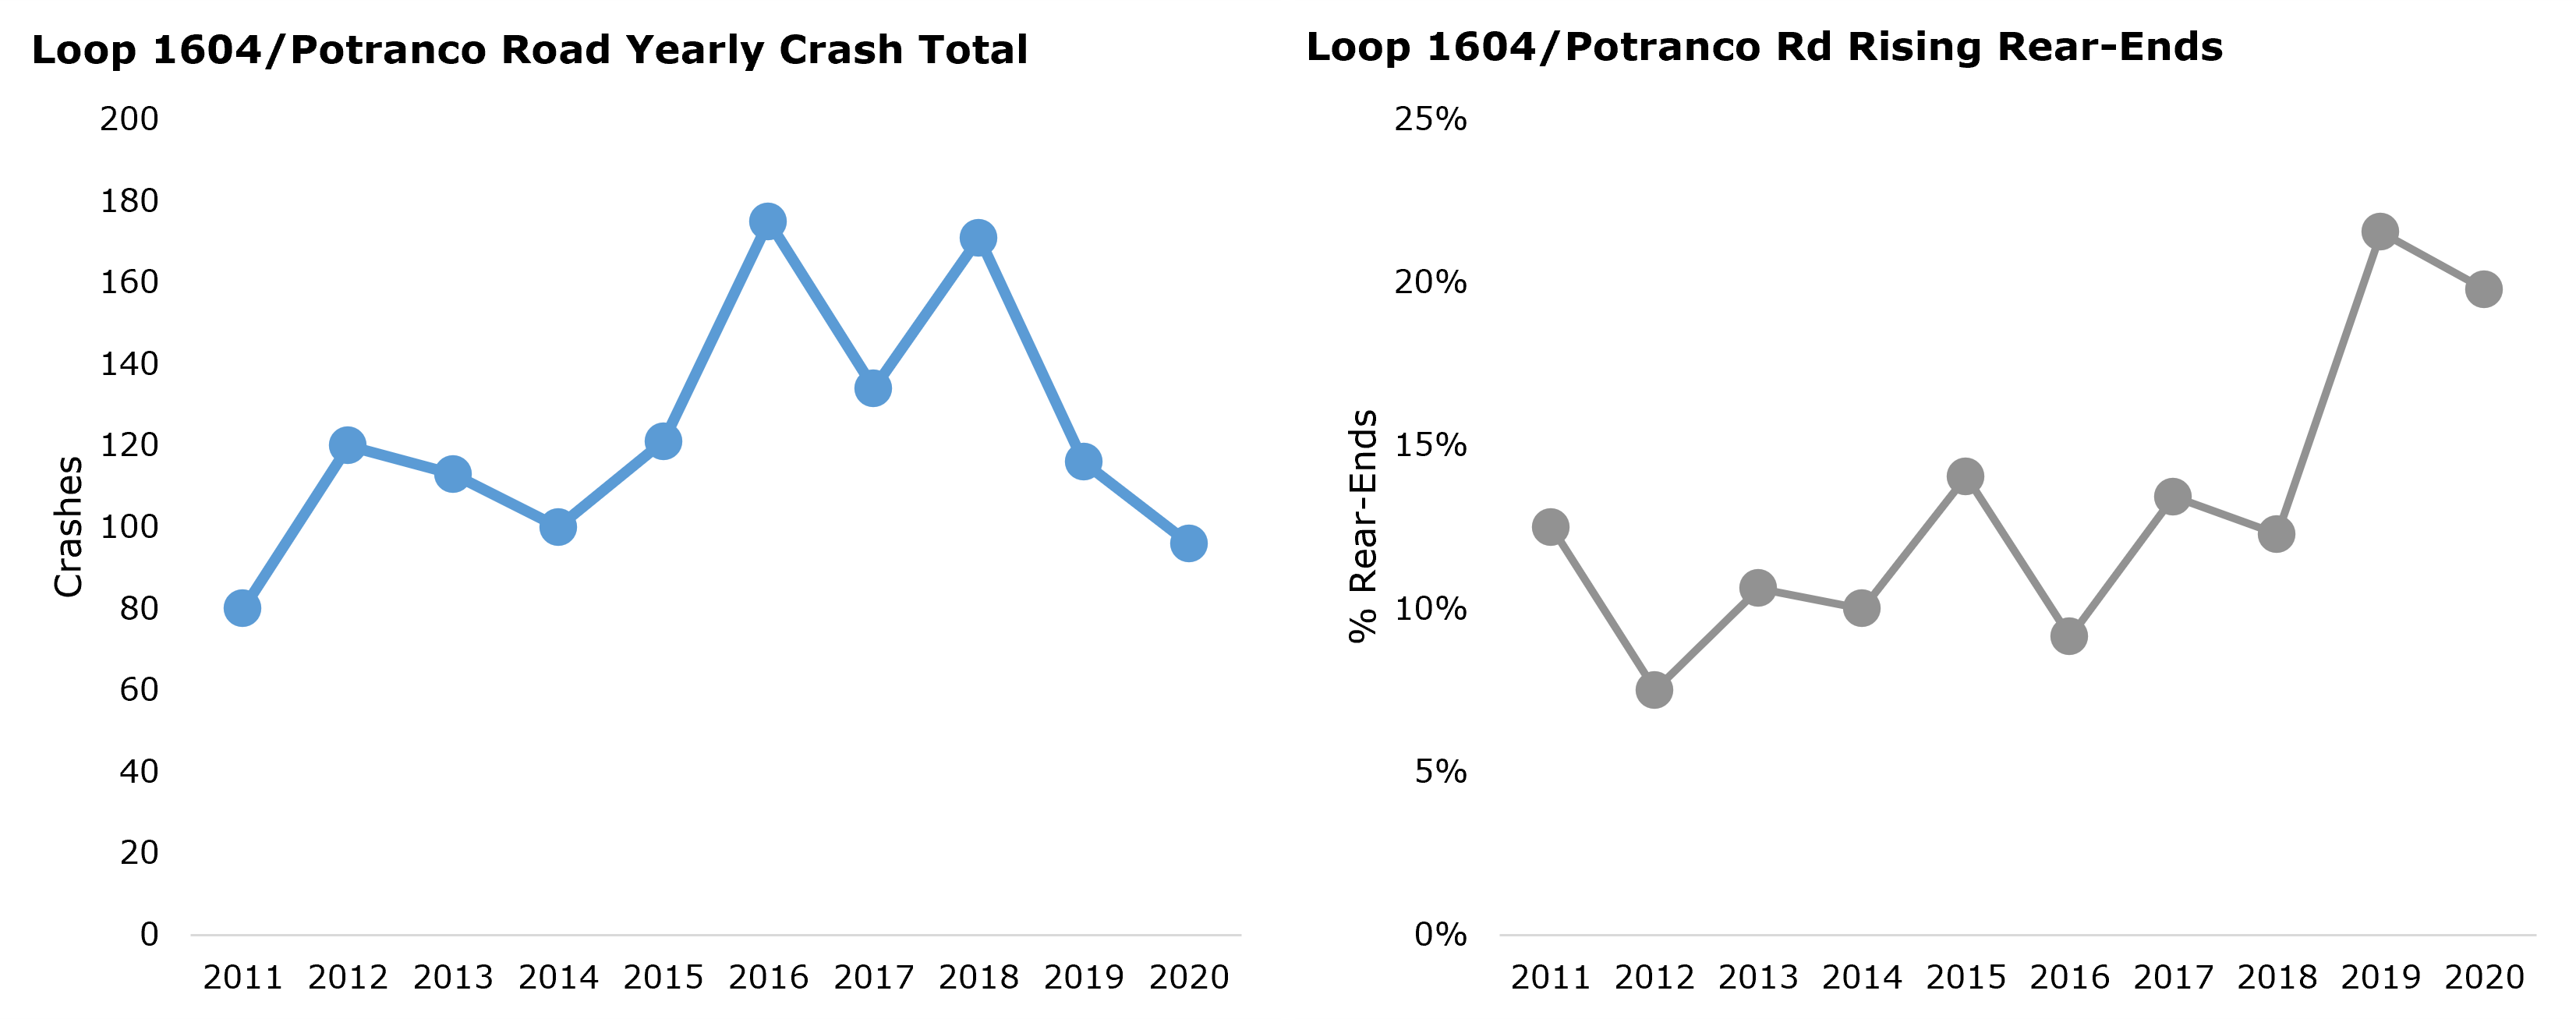
The crash data indicates an increase in crash frequency during construction, which is to be expected. After construction crash rates have dropped, but rear-ends make up a higher share of the crash type. This is also to be expected, as the mainlanes no longer are having the cross the intersection at-grade. However, this could also be an indicator of poor operations.
One person was fatally injured and twenty people were seriously injured over the last 10 years.
Unfortunately, this of crash data alone cannot pinpoint a design issue.
The Data
The data acquired for this project was from Wejo, which aggregates data from vehicle manufacturers. The “journey” data is a simple “breadcrumb” style which contains a data point every 3 seconds with speed and location.
The other dataset acquired is the “events” data where an on-board accelerometer can detect hard acceleration and deceleration. Deceleration or “hard braking” is largely what I focused on as a potential indicator of safety issues.
Hard-Braking Breakthrough
I used DB4IoT from Moonshadow Mobile, which ingests this massive amount of data and has the ability to create visualizations.
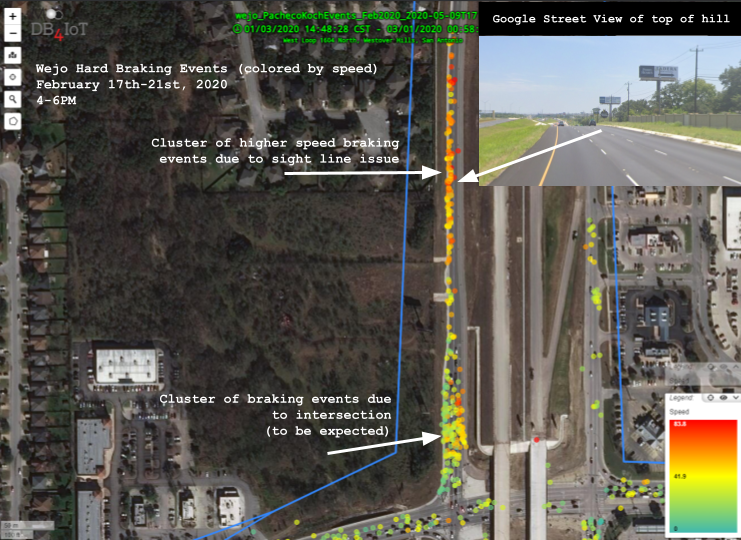
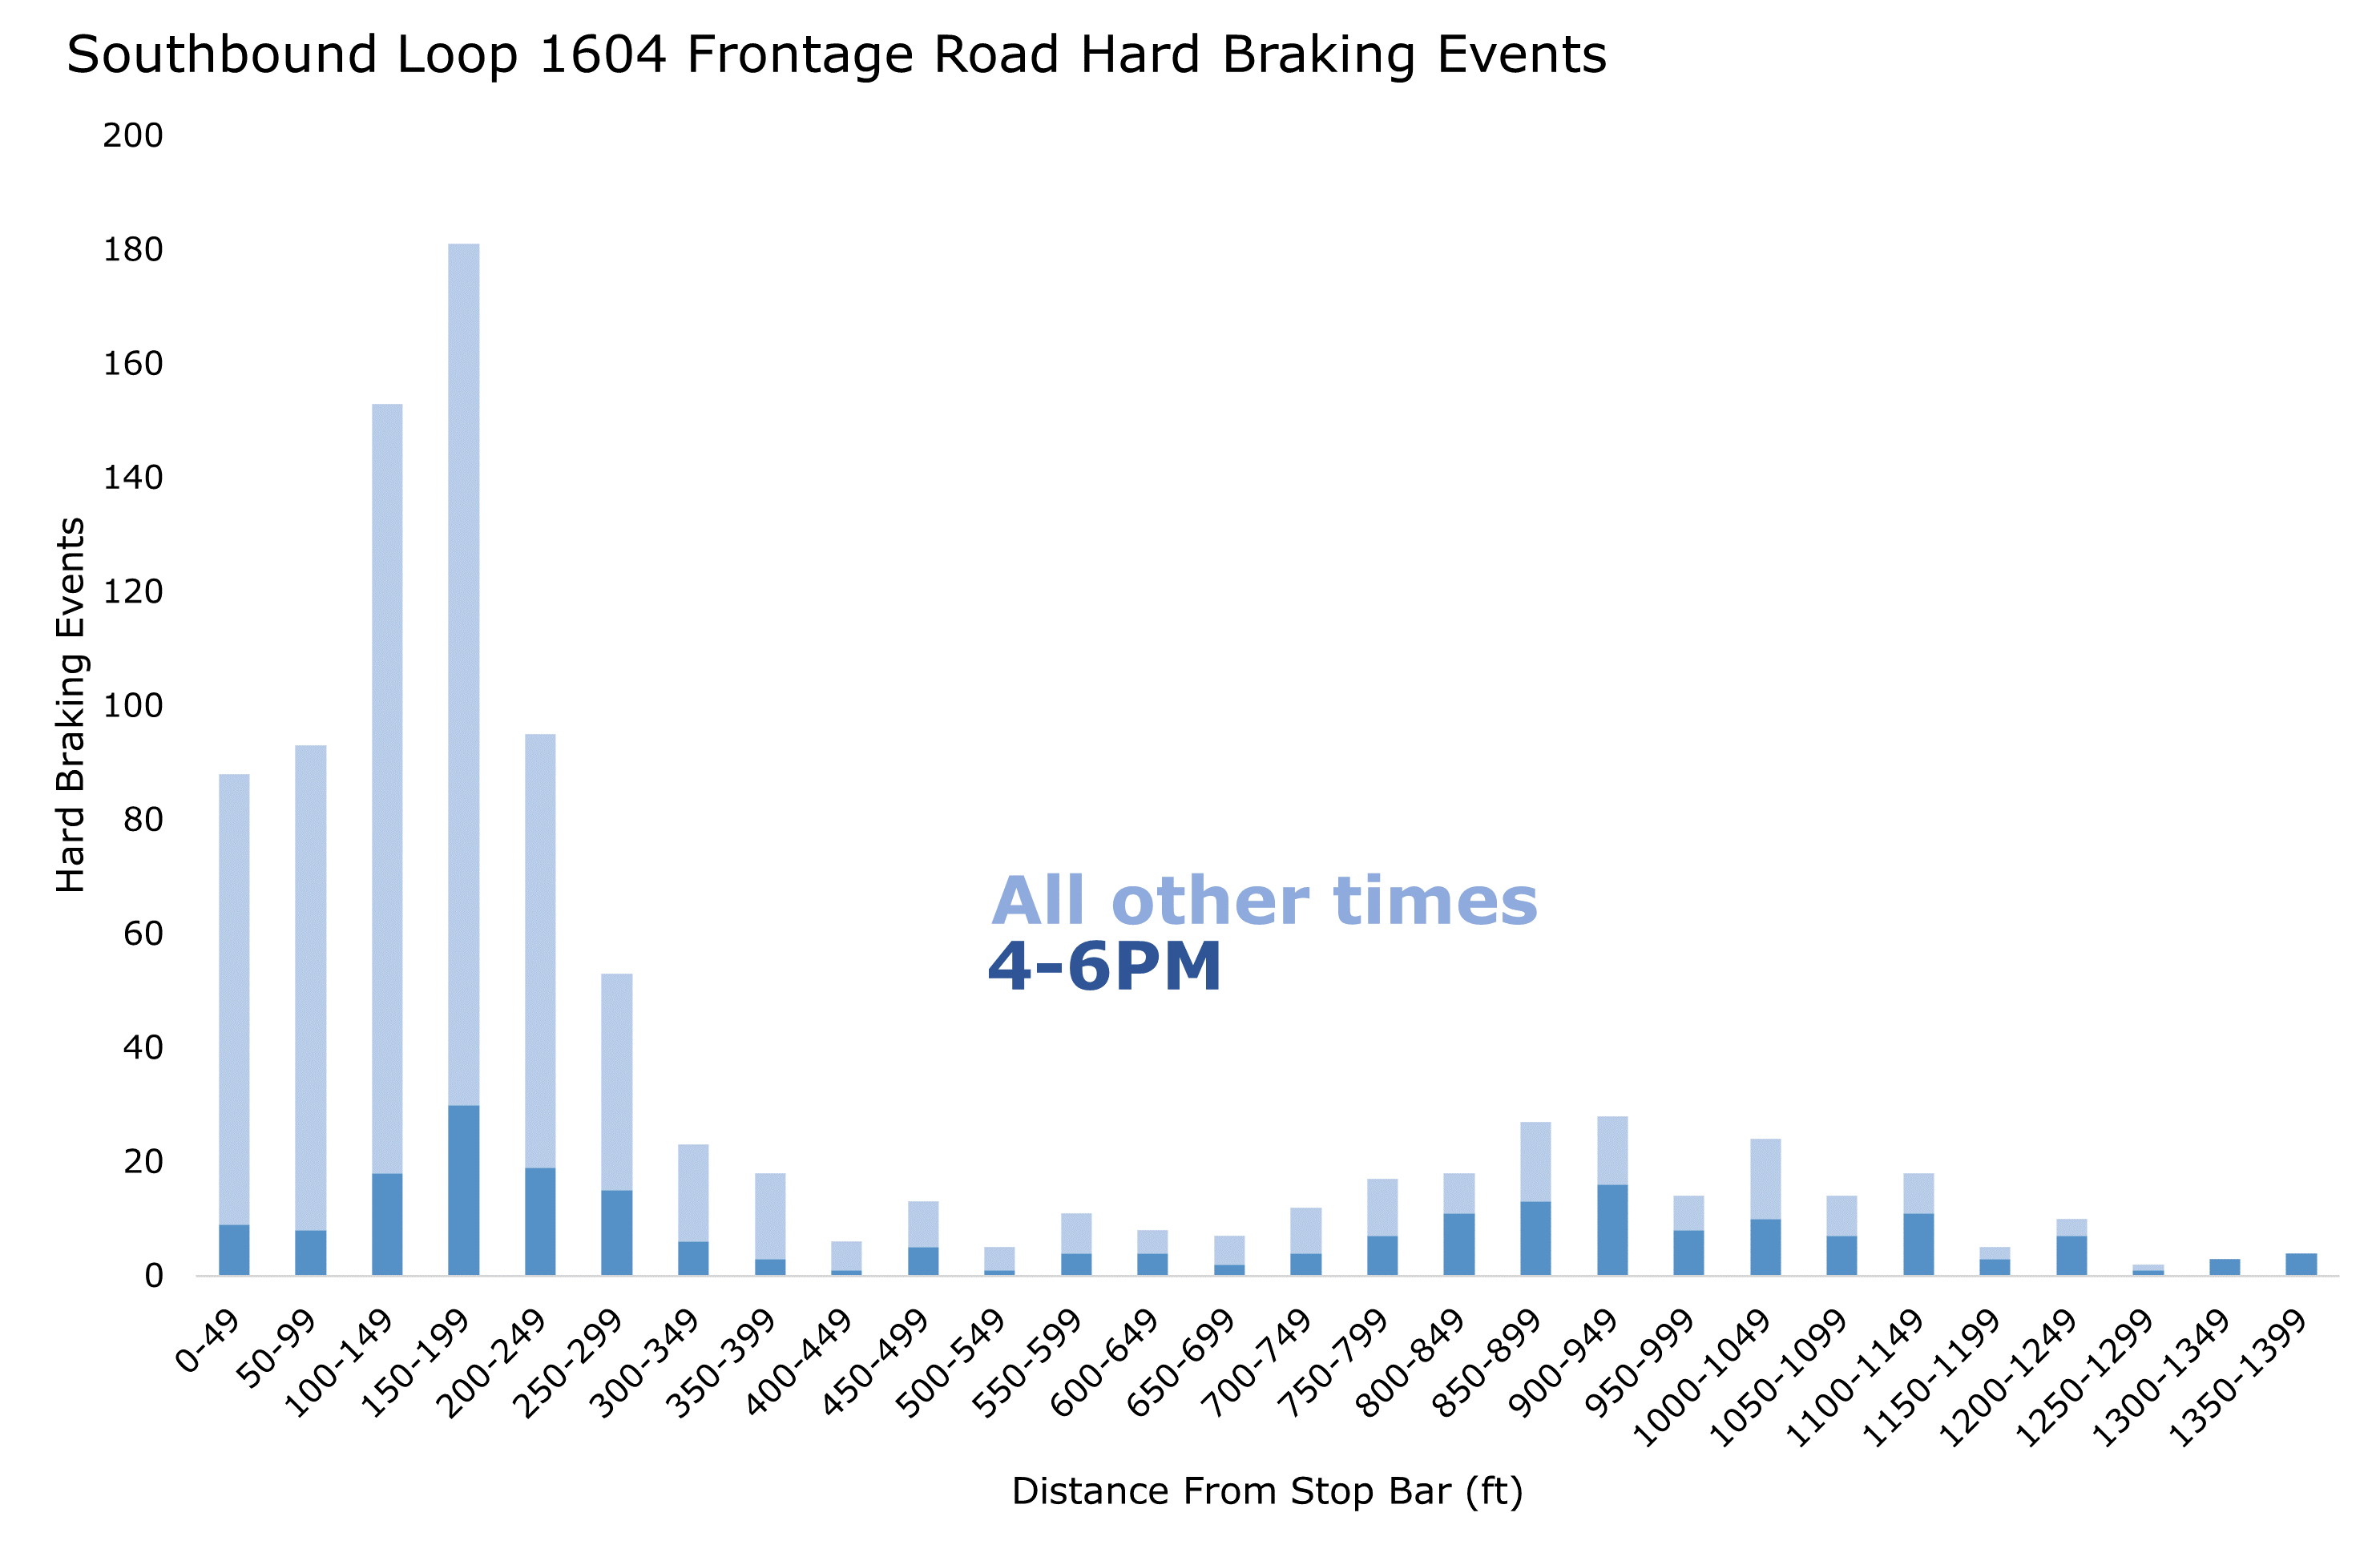
I noticed a large amount of high speed hard braking events north of the southbound frontage road intersection. Drilling down, I noticed most of these hard braking events were taking place during the PM peak hour.
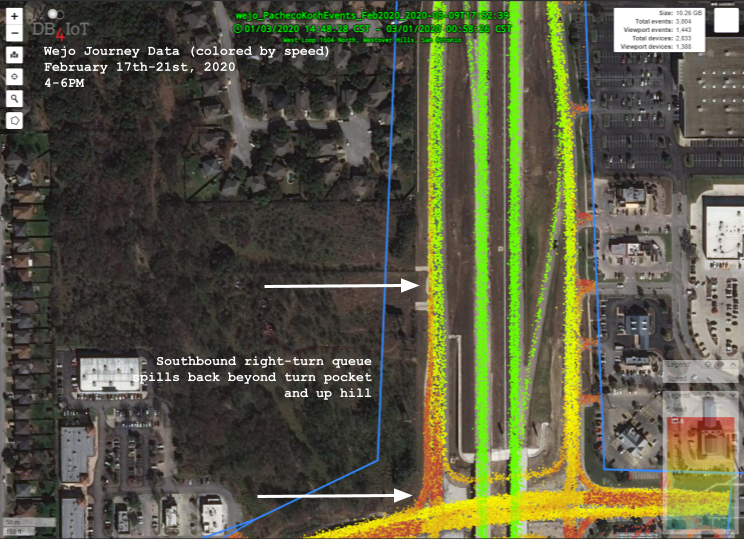
Comparing this back to the journey data, I noticed that vehicles were also queuing back from the southbound right-turn lane. This was spilling back beyond the purpose-built right-turn pocket.
Looking at Google streetview, there is a downward sloping hill leading towards the intersection. If vehicles are queuing back up this hill, the fast traffic coming off of Loop 1604 are being required to brake suddenly. This is a clear safety issue that is hard to identify without plenty of crash data or extensive field work during peak traffic conditions, which was not possible during most of 2020.
The Solution
We recommended that TxDOT should install signage warning drivers of possible stopped vehicles ahead. Other solutions could use queue detection with flashing beacons to warn drivers of a queue ahead. Potentially modifying the vertical alignment of the southbound frontage road could also address the sight line issue.
Include Connected Vehicle Data in Your Analysis
Adding connected vehicle data to your traffic safety analysis can be very helpful. First of all, no travel is required which was especially critical during COVID-19. Instead of doing field work at a couple of locations in a single day, I can quickly examine entire corridors before lunch.
Crash data is often inaccurate or inadequate at determining what safety issues are present, and can take months or years to report the most recent crashes.
Other one-size-fits-most approaches use crash rates and potential safety treatments which often lacks local insight, like how a fast food drive-through queue could spill back onto the nearby street.
Webinar
Check out the webinar I participated in with some colleagues who worked on this project with TxDOT. We discuss the other places we used this data in delivering this work.