
A snippet of personal (and some work-related) things I’ve been working on.
I’m fortunate that most of my day job is open source, you can check out my daily contributions on my github.
Machine Learning
AeroVolumes
I built an automated forecasting system that predicts how busy major U.S. airports will be, posting a daily forecast to Bluesky. The ML pipeline uses a simple ARIMA model trained on historical TSA checkpoint throughput.
To support the forecasting system, I engineered a full ETL pipeline that parses and cleans hundreds of thousands of pages of TSA PDF reports, extracting historical checkpoint counts into a structured database.
As part of this project, I also deployed a public API on RapidAPI that allows anyone to query and download data
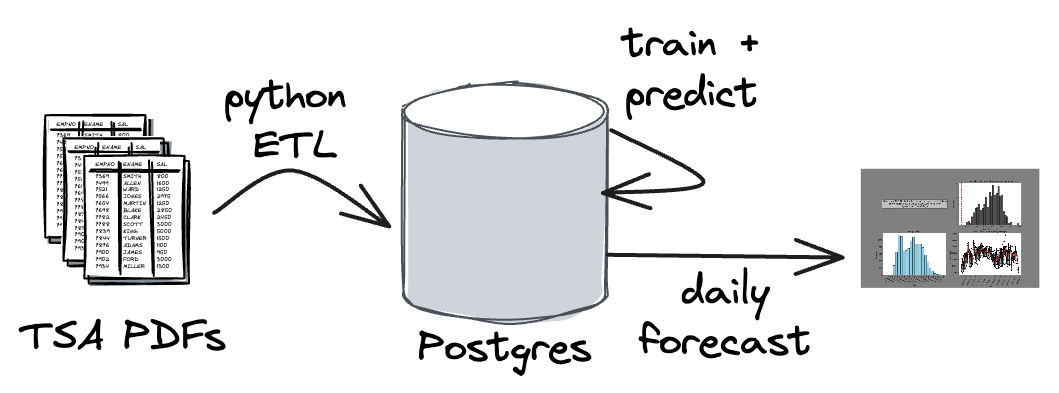 Data flow diagram of the forecast bot
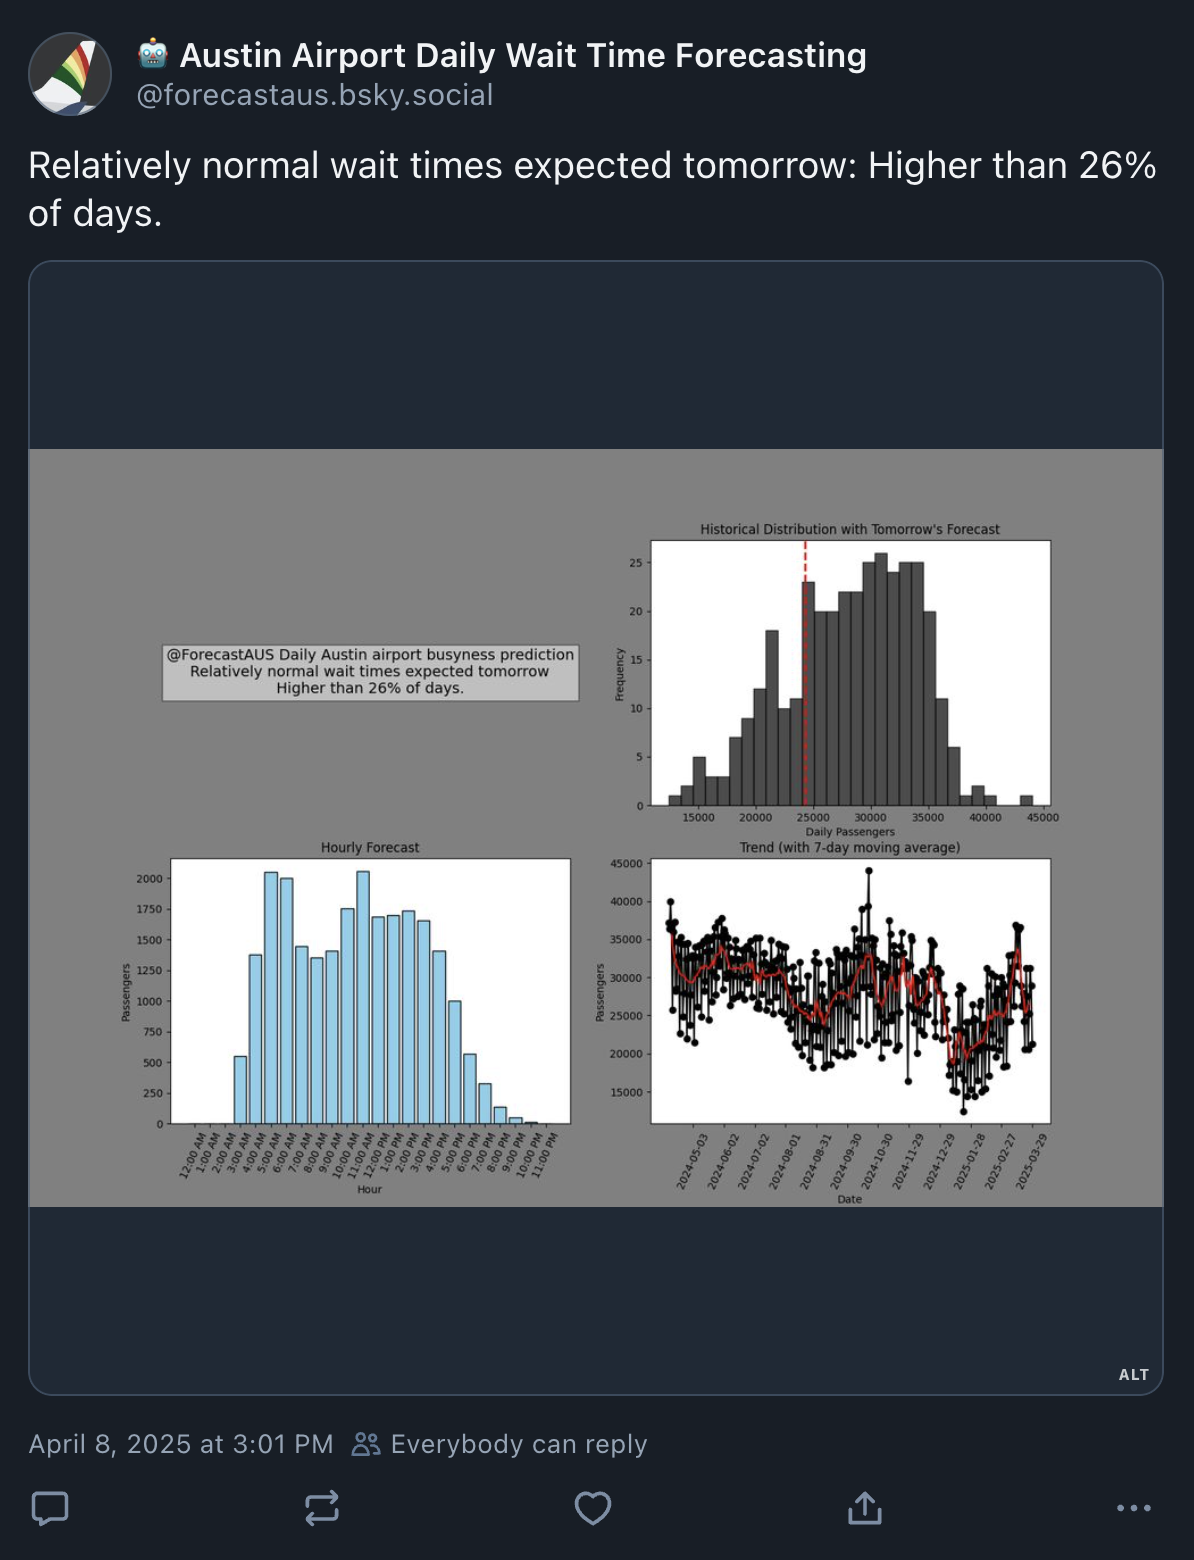 Example prediction
CFL Negotiation list tracker
I built an automated data pipeline that scrapes Canadian Football League (CFL) negotiation list updates from a website, parses roster information, and publishes structured player datasets to a public site.
To enrich each player profile, I developed an ML pipeline, which analyzes historical player data, college backgrounds, and pro experience to generate high level scouting summaries. These insights are served through my site and updated automatically as new players appear on negotiation lists.
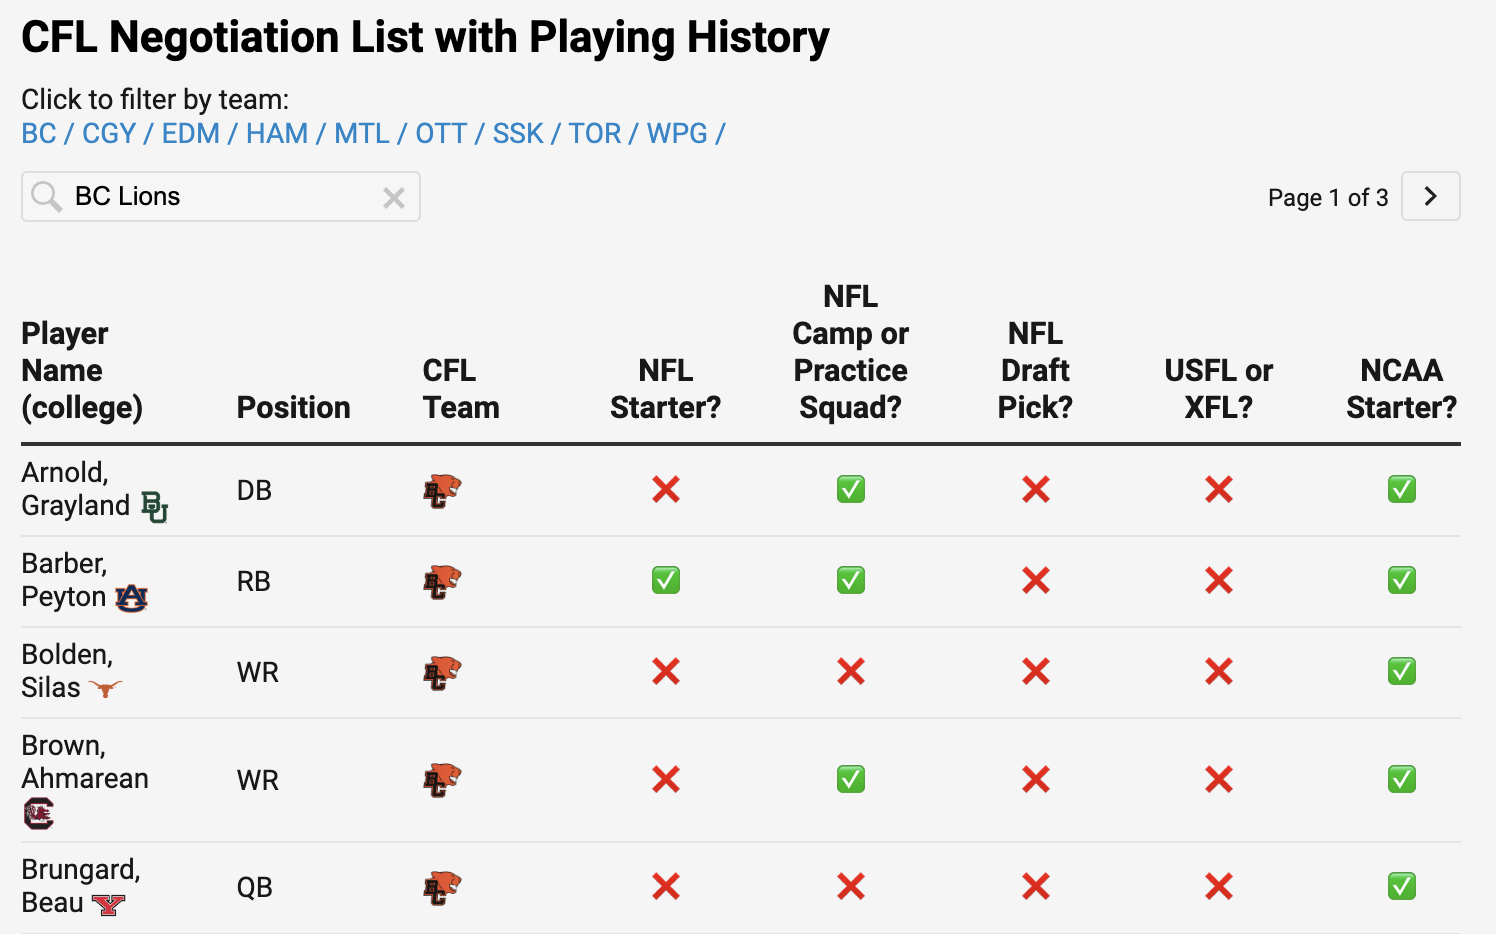 Playing history table created with an ML pipeline
Data Engineering
Austin Road Conditions
I built a Bluesky bot that posts live road condition updates for Austin using real-time roadway friction sensor data. Every 5 minutes, the ETL checks the City of Austin’s public sensor feed for changes in road conditions. When a change is detected, the bot generates a new post and attaches a screenshot from the nearest traffic camera.
The entire pipeline is open source and designed to be deployable in other cities with similar open sensor data.
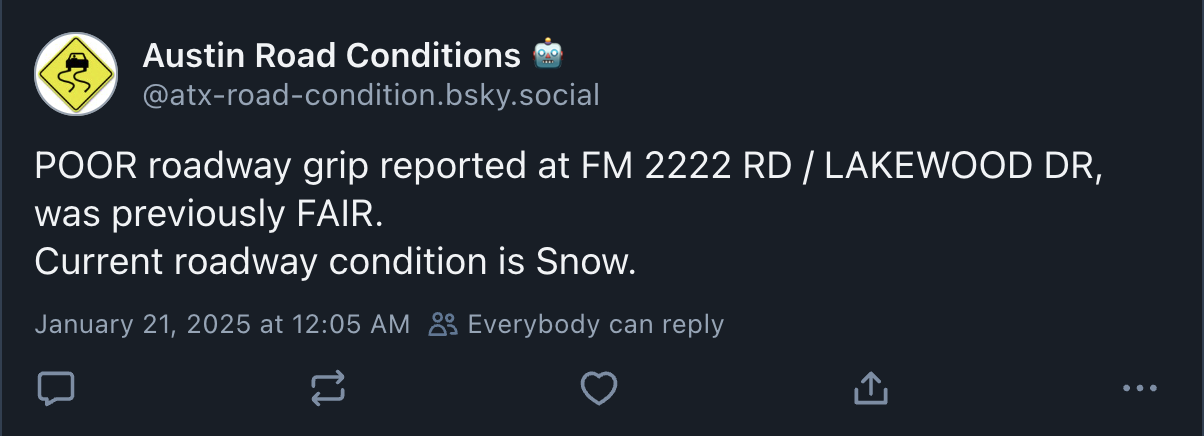 Example post
Voter Turnout Scraping
For 2024’s early voting period I set up an ETL script that scraped live voter turnout data and plotted it alongside a comparison to the the 2020 election.
The archived post along with more visualizations is available here. I also created a similar post for the 2025 election.
 2024 live voter turnout comparison
Data Visualization
Clark County Crash Data Viewer
I created an interactive web map for visualizing traffic crash data in Clark County, Nevada.
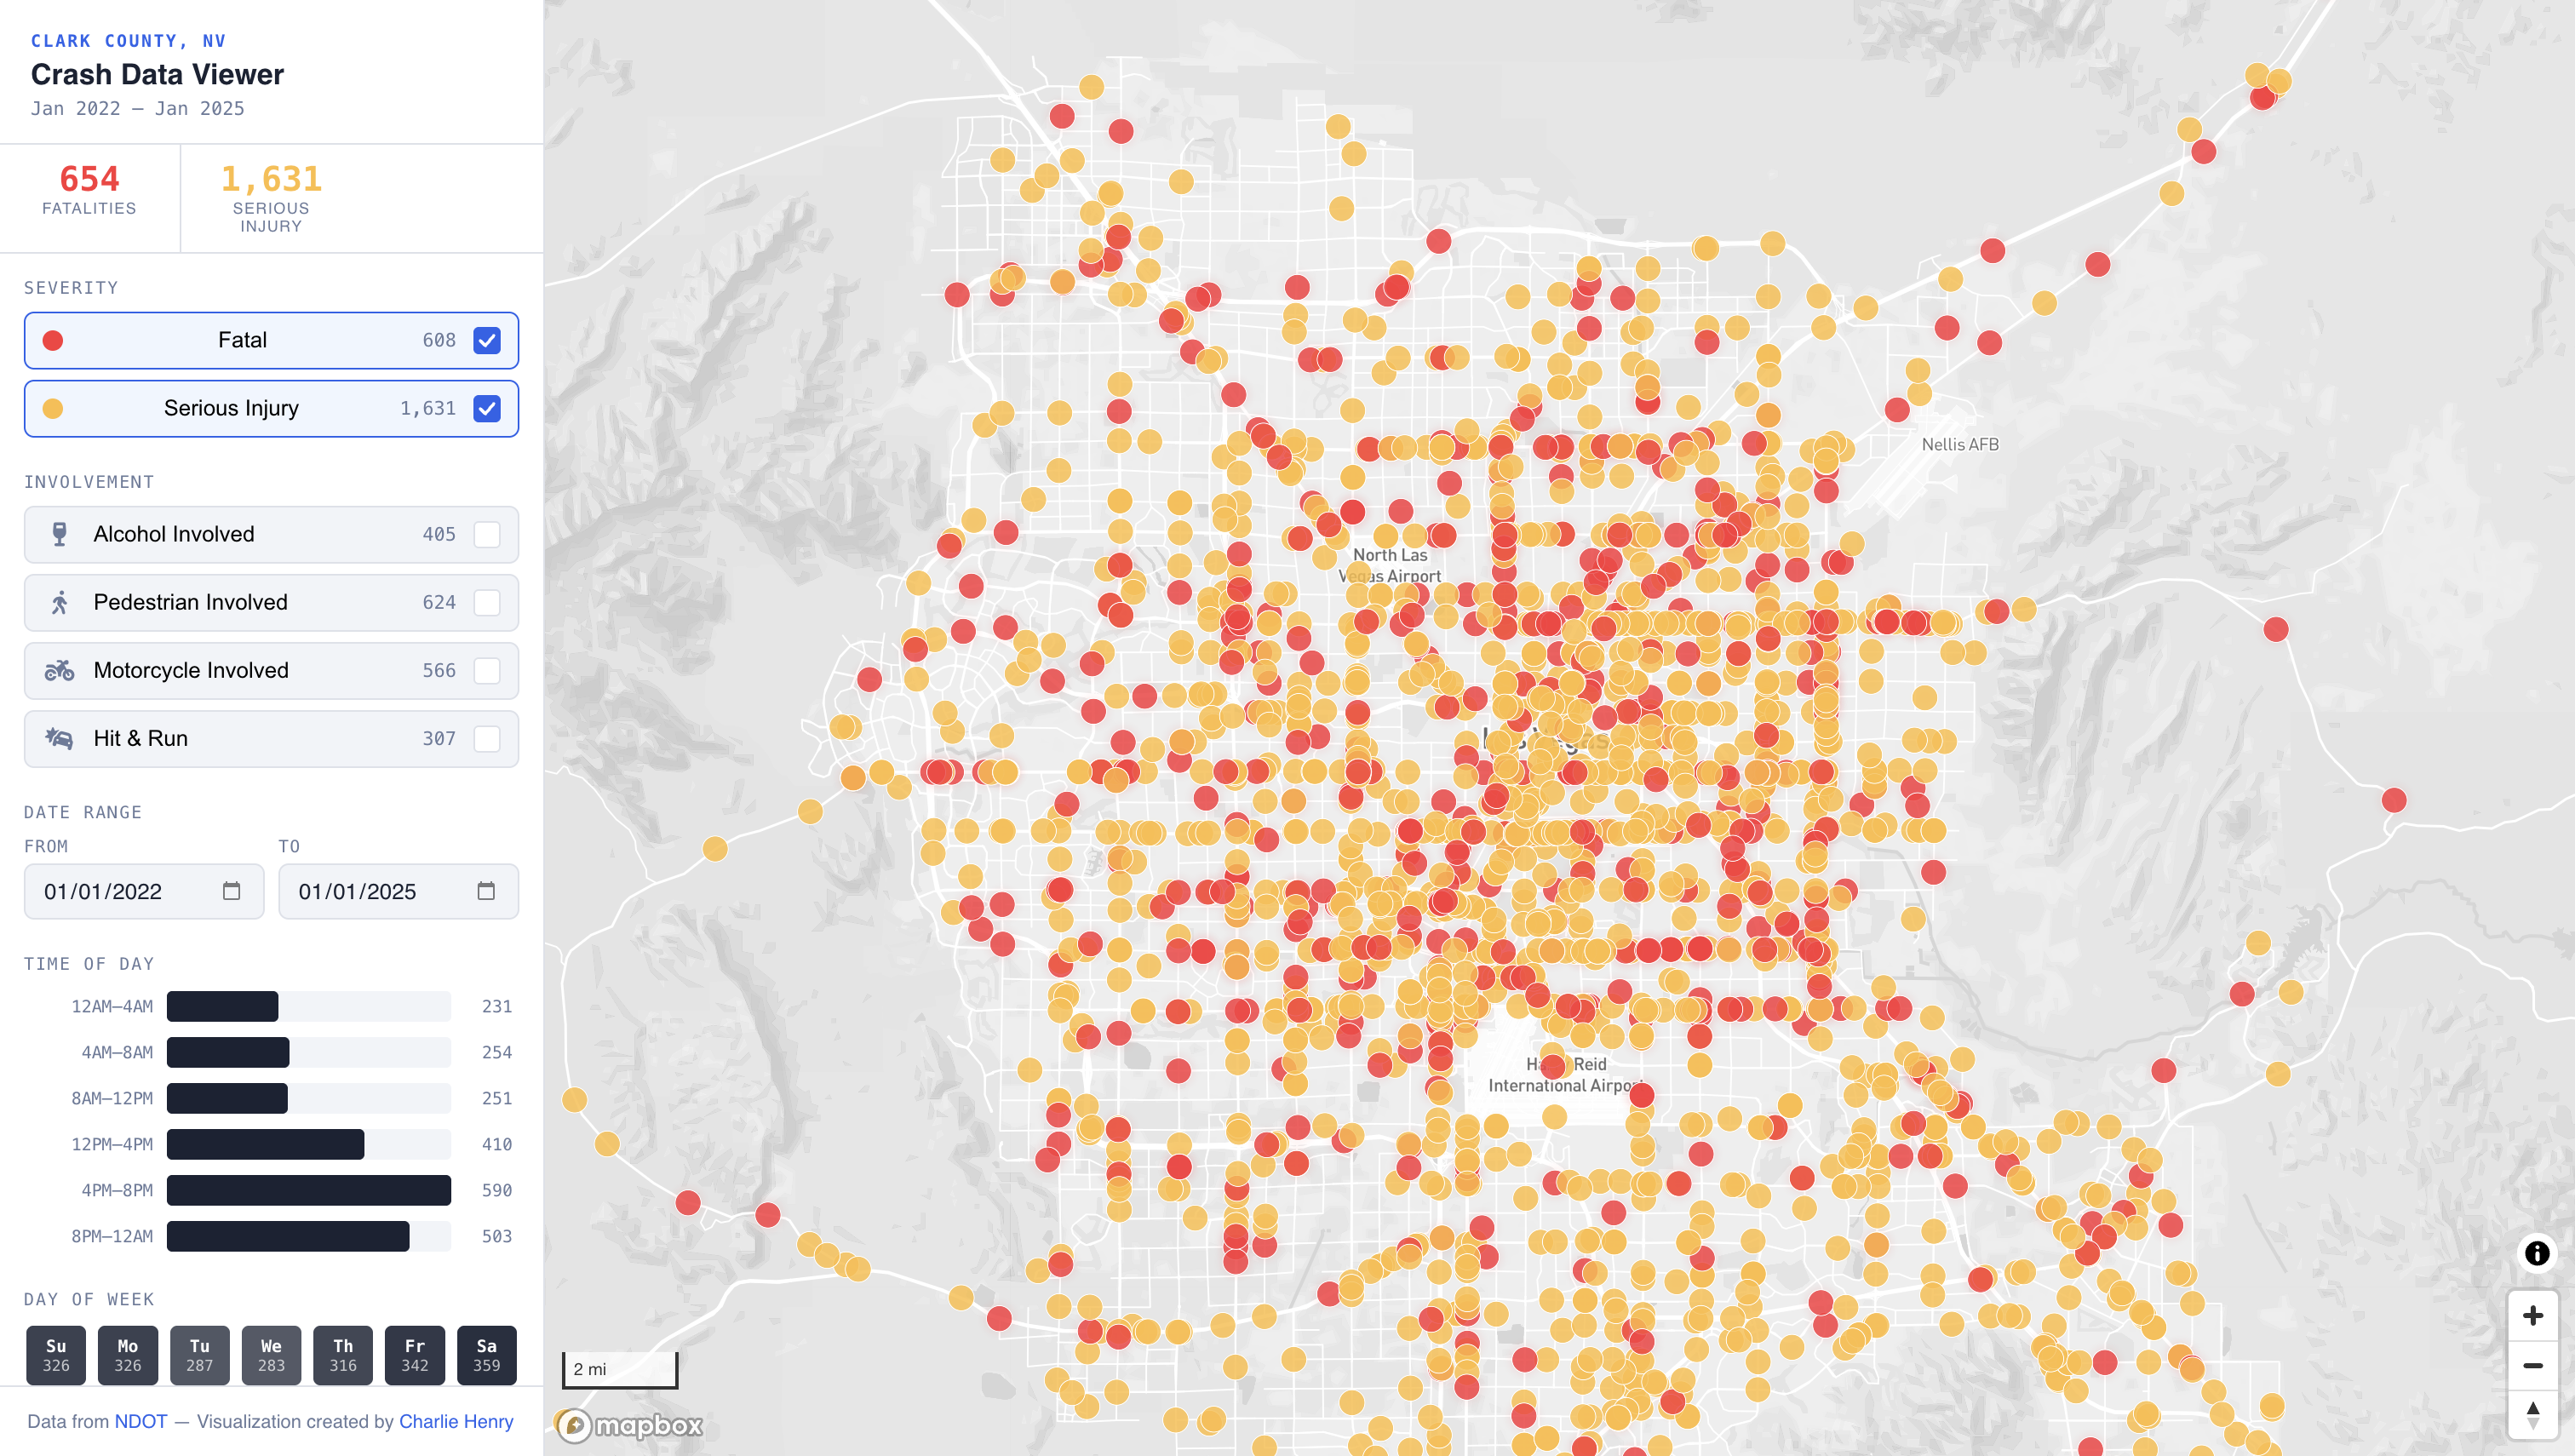 Crash Data Viewer
2026 Texas Primaries Election Night Interactive
I created an interactive county-level election map for the 2026 Democratic and Republican primaries in Texas. Heavily inspired by the “big boards” used on TV by Steve Kornacki and John King. I also set up a script that populated the map with real-time results from the Texas Secretary of State website. The repo is open source and available here.
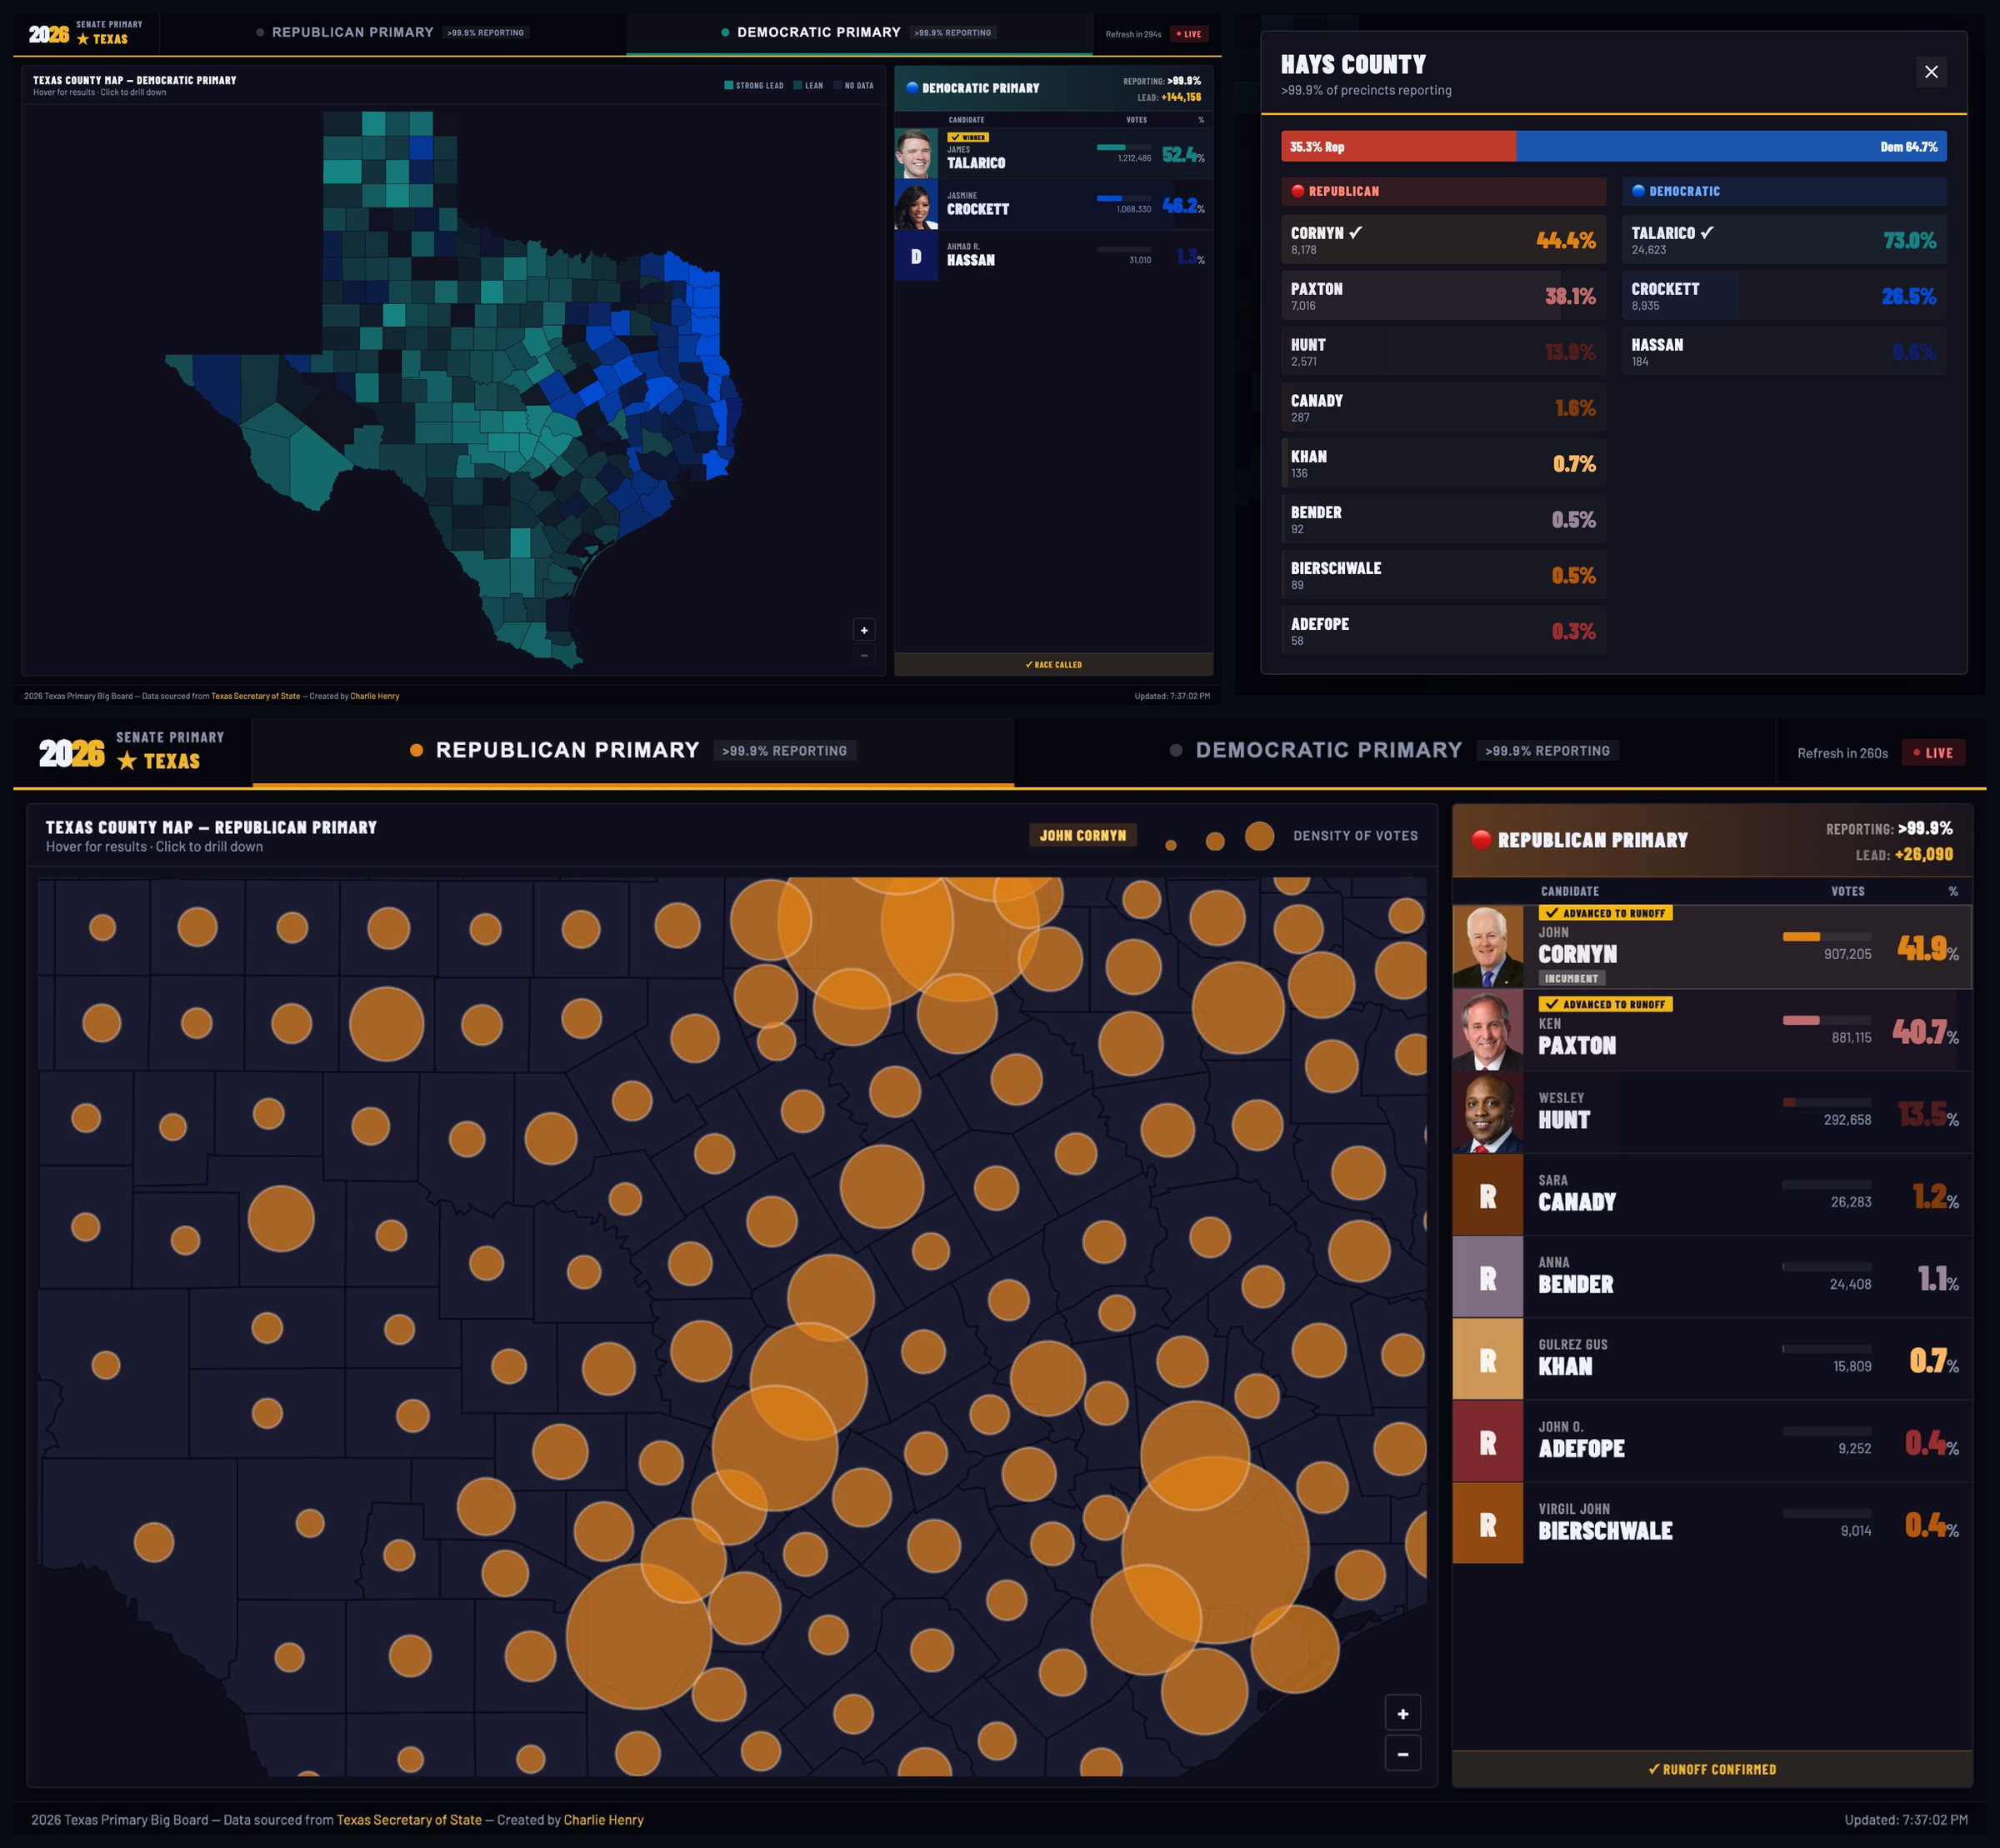 Election Night Interactive
2024 Elections Visualizations
One topic I frequently visualize is elections. My atx-elections-data repo contains several examples of code I have written to visualize elections mostly in Texas.
 Precinct-level election shifts
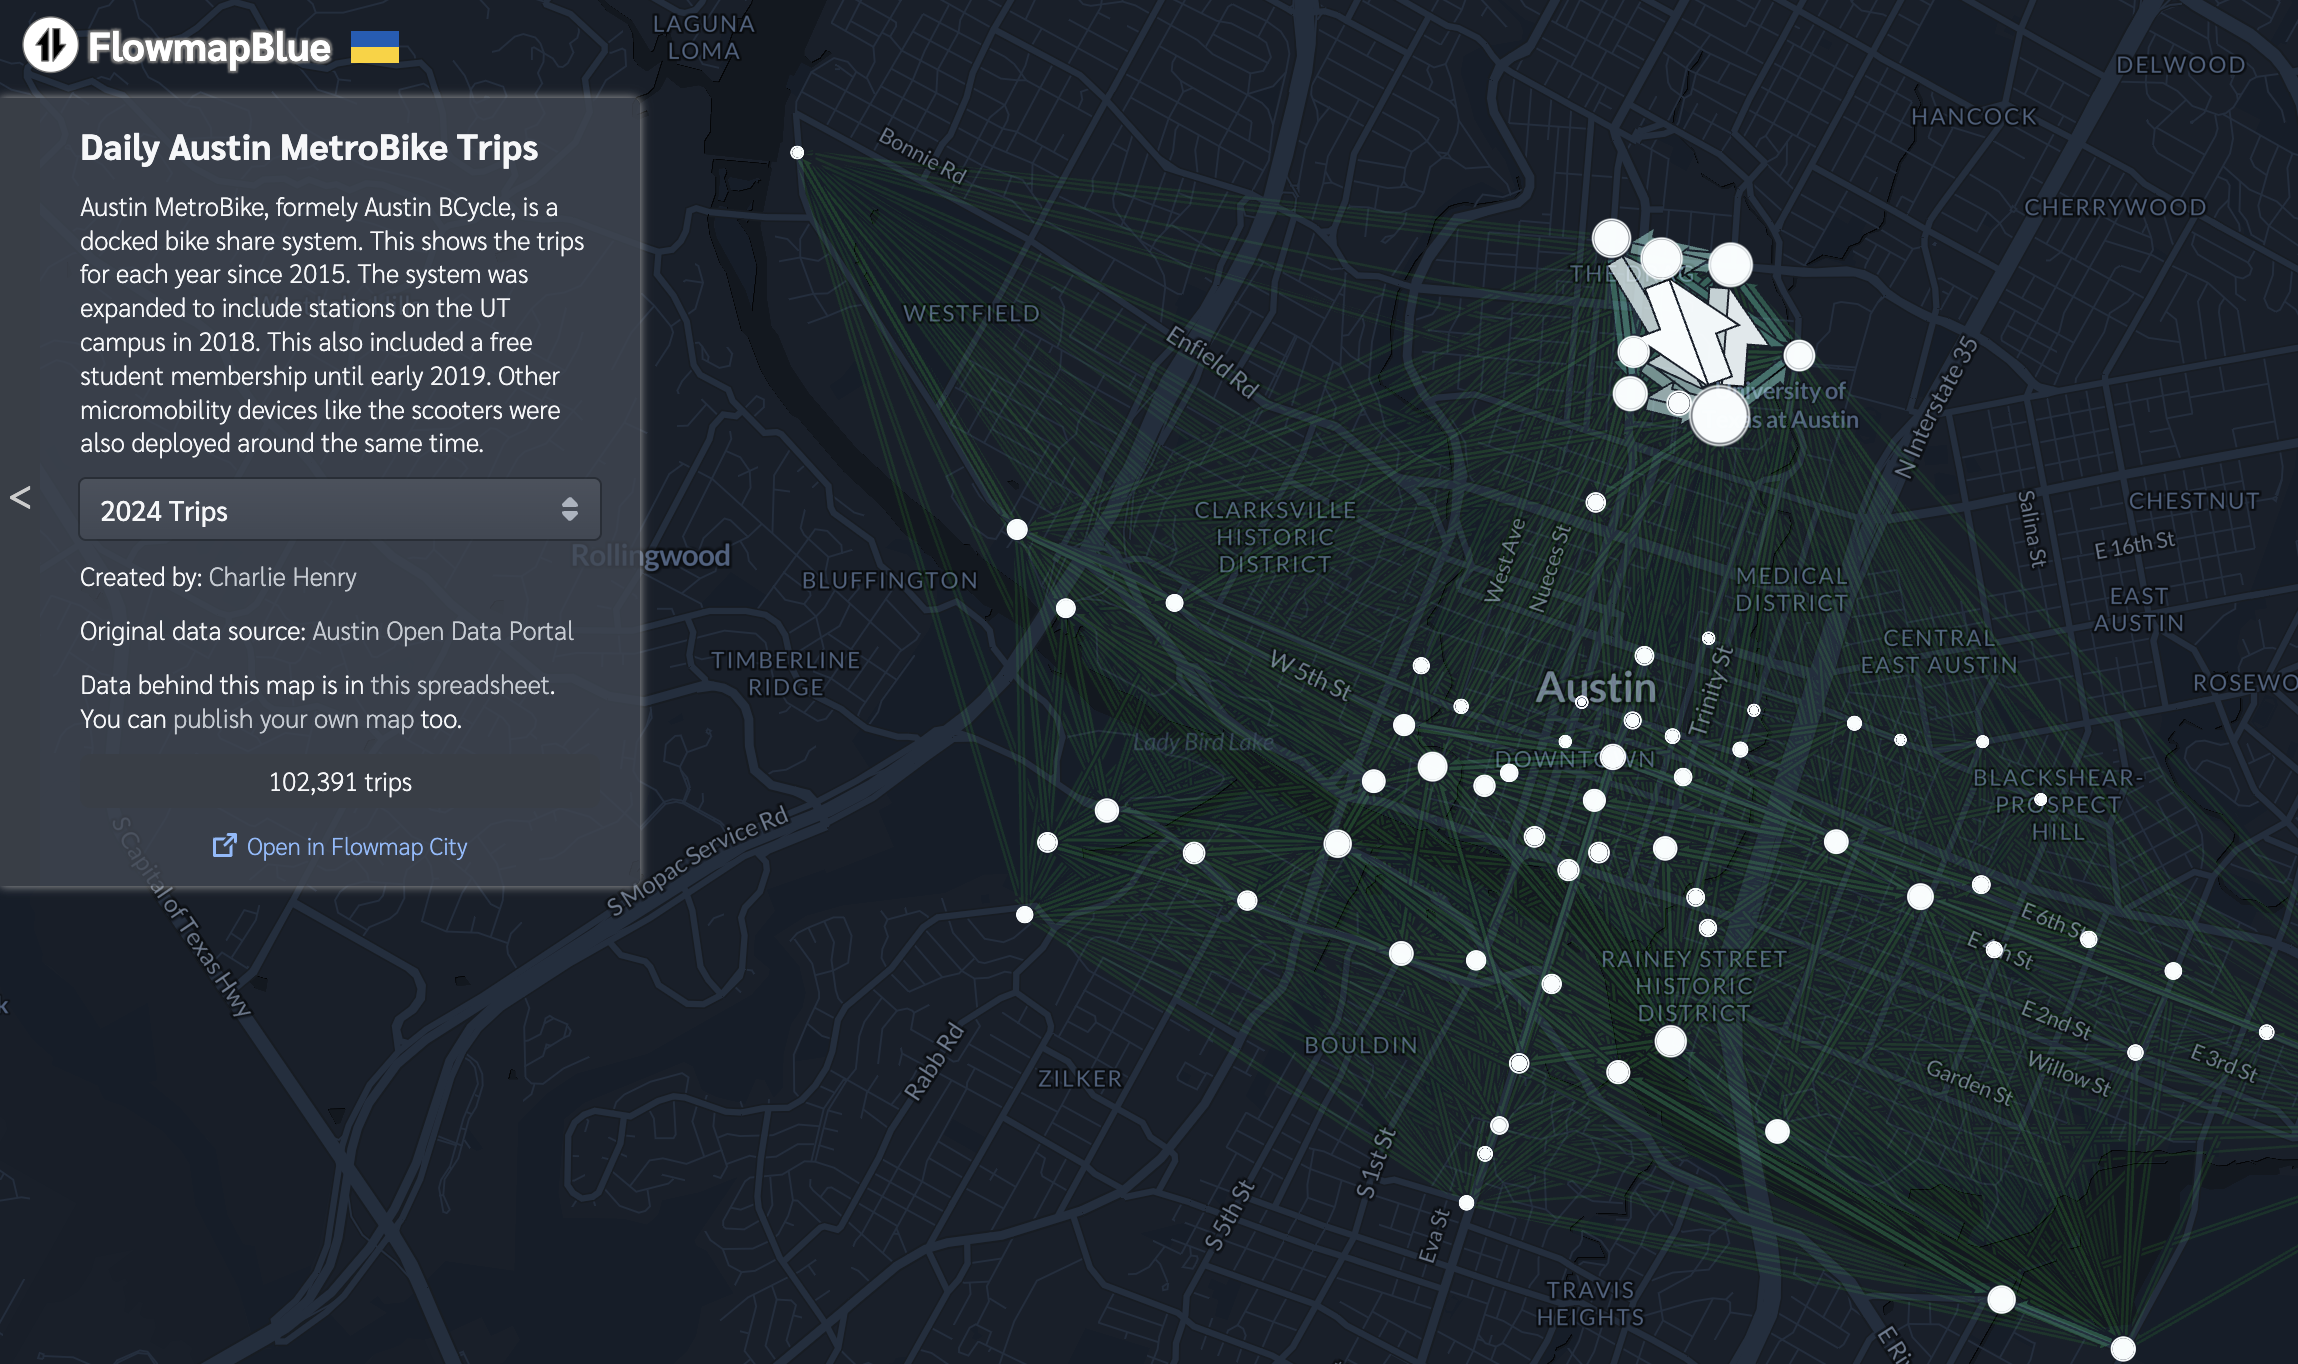
Austin MetroBike Trips Visualization
Using a tool called flowmap.blue I was able to quickly visualize multiple years of docked bicycle data. It is featured on flowmap.blue’s examples page.
Created with: Python, Google sheets
Skills Summary
Programming
- Python (expert): data engineering, ML modeling, automation, API development
- R
- Java
- Javascript
Data Engineering & Infrastructure
- End-to-end ETL development with Python, dbt, and SQL
- Docker containerization and deployment
- SQL (Postgres, Oracle): schema design, optimization, data transformation
- Workflow orchestration: Prefect (cloud), Apache Airflow (on-prem)
Cloud platforms:
- AWS: S3, EC2
- GCP: BigQuery, Cloud Functions, Cloud Storage
- Automated pipelines for PDF extraction, web scraping, and real-time sensor ingestion
Data Science & Machine Learning:
- Machine learning with PyTorch, XGBoost, Scikit-learn
- Experience with supervised learning, deep learning, PCA, ARIMA time-series forecasting, and generative AI (Gemini, OpenAI)
- Model deployment and monitoring for production data products
Business Intelligence & Visualization:
- Power BI (expert): dashboards, DAX, modeling
- Hex (expert)L: notebooks, SQL + Python workflows
- Tableau (intermediate)
- MicroStrategy (intermediate)
Education & Certifications
Education:
- Master’s of Science in Data Science, University of Texas at Austin.
- Bachelor’s of Science in Aerospace Engineering, University of Texas at Austin.
Certifications:
Master’s Coursework:
- DSC 385T: Data Science for Health Discovery and Innovation
- DSC 391L: Principles of Machine Learning
- DSC 394R: Reinforcement Learning
- CS 388: Natural Language Processing
- CS 394D: Deep Learning
- CS 395T: Data Structures and Algorithms
- DSC 385: Data Exploration and Visualization
- DSC 383: Advanced Predictive Models for Complex Data
- DSC 382: Foundations of Regression and Predictive Modeling
- DSC 381: Probability and Simulation-Based Inference