
September 15th, 2021 thoughts & takeaways:
-
I’ve included a new chart below that will update every evening that shows the last 7 day’s traffic broken down by time of day. The morning peak is still almost non-existent and nowhere near the pre-pandemic levels.
-
June, July, August were all 88 to 89% of normal conditions with no discernible bump after the return to school in early August.
-
Now that students are back on campus at UT, mircomobility trips have reached a new record high.
-
Airport passengers peaked back during the 4th of July Holiday. Since then, there has been a pretty steep drop off to March 2021 levels. The lack of business travel has really caused there to be a steeper drop off during the “shoulder” seasons of the late summer/early fall.
July 12th, 2021 thoughts & takeaways:
-
June airport passenger traffic was 99% of “normal”, as compared to February 2020. I’d expect the 4th of July weekend to be a big spike in the data.
-
Daily traffic volumes ticked up by about 5% in June to about 90% of normal traffic conditions.
-
As theorized, the spike in incidents in May was likely caused by the rainy weather. The daily rate has fallen down to about 125 incidents per day.
-
The Google mobility data is something I have been watching closely over the past couple weeks. Travel to workplaces is still only about 65% of pre-covid numbers. Travel to Transit Stations has actually surpassed the workplaces category and is 70% of pre-covid.
June 4th, 2021 thoughts & takeaways:
-
A big jump in passenger traffic at the airport over the course of May. The last day of available data (Saturday, May 15th) shows 99% of normal pre-covid passenger traffic. The weekends are
-
Traffic volumes did moderately tick up over May to about 85% of February 2020 conditions.
-
I wrote separate post theorizing, Did COVID Fix Austin’s Traffic Forever?
-
The uptick in traffic incidents is likely caused by the 4th wettest May on record.
May 4th, 2021 thoughts & takeaways:
-
Traffic volumes were about 82% of the pre-COVID numbers during April, which is only about a 1-2% increase since March. The big rebound in traffic volumes that was potentially expected after the removal of COVID restrictions in March and the vaccine distribution hasn’t happened. Yet?
-
Ignoring the potential outliers back on October 4th and 5th, a new daily post-COVID record was set for traffic volumes on April 25th where volumes were 90.0% of normal conditions.
-
Bird deployed some a new scooter model to Austin streets over the past month. A new operator “LINK” has deployed 500 scooters. April kept pace with the increase during Spring Break and averaged about 70,000 trips a week.
-
Passengers through the Austin Airport TSA checkpoint have rebounded to about 60% of pre-COVID numbers.
April 16th, 2021 thoughts & takeaways:
-
During March, the Governor rescinded all COVID restrictions for the state. The City of Austin still has a mask mandate in place, for now. The relaxing of restrictions, along with the roll out of the vaccine have combined to increase traffic volumes to above 80% of normal traffic conditions. Some days have been closer to 90% of typical traffic, especially on weekends and on Fridays.
-
Both TSA checkpoint passengers and micromobility trips saw a big spike during spring break.
-
The Google Mobility data shows “residential” trips are at low point since this time last year. This means more trips people are taking are less “home-based” than they were during the height of the lockdowns.
March 8th, 2021 thoughts & takeaways:
-
We had quite the winter storm during the week of President’s Day. The airport saw no passengers for almost three days and traffic incidents hit record highs. Valentine’s Day saw an insane 400 traffic incidents reports. Due to the power outages the city’s website and 3-1-1 service was down for parts of February 15th which likely broke a lot of the data collection on the City’s end. Many intersections (7 of 13) were not reporting any traffic volumes due to the signal being completely dark. I’ve averaged the missing data to get a sense of what volumes we might have seen out there.
-
The Governor will repeal all of his COVID restrictions as of this Wednesday. The last “re-opening” we had back in May caused traffic volumes to steadily increase until the surge in cases in June/July. With the added re-assurance of vaccinations (for those who have gotten one), it will be interesting to see if traffic will return and if it will break the 70% of normal level we have seen since last summer.
February 2nd, 2021 thoughts & takeaways:
-
I am now showing almost an entire year of data going back to February 1st, 2020.
-
There is an interesting bump in traffic in the lead up to Christmas. Boxing day was only eight thousand more vehicles more than Thanksgiving day and the second lowest daily traffic I’ve recorded.
-
January 10th, 2021 was the highest number of traffic incidents recorded since COVID. This was due to a snow “storm” that came in that morning.
-
Micromobility trips are down since the students aren’t around as much from Thanksgiving-February. Also the weather sometimes doesn’t cooperate.
-
January 3rd, 2021 set a new daily record since COVID at the AUS TSA checkpoint. The extra-long weekend caused by New Year’s Day falling on a Friday really compressed traveler’s schedules. December 8th, 2020 was the least busy day at the airport since Independence Day caused by the lull in leisure and business travel between Thanksgiving and the Holidays.
December 14th, 2020 thoughts & takeaways:
-
Since I last updated this post, we’ve had the Thanksgiving holiday. Thanksgiving has a reputation of a big traffic day. However, Thanksgiving day was the lowest traffic volume day since April. Since October the weekly moving average is pretty stable at about 70% of pre-pandemic levels.
-
Air travel at the Austin airport did just barely break a new daily (pandemic) record of 11,000 passengers through TSA turnstiles on November 8th. The day before Thanksgiving is traditionally the busiest air travel day of the year, Austin had 10,900 passengers. After the initial slowdown, Austin’s share of US passengers has remained stable at about 1% since June which is a good sign for the future.
-
Revel mopeds have left Austin. Daily micromobility trips have dropped back down to about 4,500. This probably has more to do with the colder weather, ending of the semester at UT, and the Thanksgiving holiday.
October 1st, 2020 thoughts & takeaways:
-
This past week saw traffic volumes decrease about 7%. This is the biggest weekly decrease since March. Its not entirely clear but I assume it has to do with people staying close to home now that virtual schooling is in full swing (for the time being).
-
I’ve added another update to the TSA checkpoint data. We set a new daily record for passenger traffic during the Labor Day weekend. The 4th of July and Memorial Day also saw a similar bump in Austin air travel.
September 22nd, 2020 thoughts & takeaways:
-
It’s that time of year where the intersection volumes data goes haywire due to some cold fronts and weather. I assume the city just loses communications with the devices for a period of time. I’ve gone back and filled in the missing data using an intersection average % of the day’s total.
-
Obviously this isn’t perfect and now I am showing August 28th as a record high traffic day (since March 13). A peak before the Labor Day weekend is now pretty clear as well. This was followed by two weeks of decreasing volumes.
-
The Governor’s re-opening plan continued again the past week. This opened restaurants to 75% capacity among other things, however this is definitely not getting the media coverage his “phase 1 re-opening” did back on May 1st. I’ll say it again, until in-person school returns we probably won’t see any significant increase in traffic volumes.
-
Last weekend we saw over 14,000 micromobility trips for the first time since March 6th. The city is classifying all of the vehicles as “scooters” in the data they publish since JUMP e-bikes were removed back in March. The city seems to not include Revel mopeds in this dataset and classifies the Wheels e-bikes as “sit down scooters”.
September 1st, 2020 thoughts & takeaways:
-
Traffic volumes ticked up again last week. I won’t expect this to change that much until Austin schools are back in session.
-
I’ve updated the TSA checkpoint data with some of the latest numbers. I find it interesting we dropped below our typical 1% share of USA passengers since the spike in cases in late June. This data is an absolute nightmare to work with (hundreds of PDF pages).
-
Micromobility trips have shot up this month. It seems to be in line with students being back in session at UT. Many leases in West Campus start August 1st so that’s probably why we see a big tick up around then. Lime has also been giving out $10 in free rides to students last week.
August 26th, 2020 thoughts & takeaways:
-
Last week, traffic volumes ticked up 3.2%. However, over the past two months we’ve been pretty flat. We have yet to break the daily record set back on June 12th.
-
I’ve removed the Apple/Austin data comparison figure because I think the data is pretty biased and not very useful.
-
I’ve changed the volume forecast model to take into account the COVID-19 cases, rather than deaths. This data is from COVIDhub and is an ensemble model. To remove day-of-week affects, I’ve also decided to go with an average daily traffic per week analysis.
-
I’ve also included Google search trends data as well as Google mobility data. This allows for a scenario forecast where if we decided to end the lockdown completely we’d see a jump in traffic volumes (but not completely back to February levels), or vice versa where we’d go back to a March-level lockdown.
August 17th, 2020 thoughts & takeaways:
-
This update is only for adding the volume projections graphic.
-
Currently, the model only is seeing the reported (or projected) COVID-19 deaths and the day of the week. A 3rd degree polynomial provides the best fit for the data.
-
Why do you show traffic decreasing? Note that the COVID-19 projections do not account for day-of-week variation while the traffic model does. This may cause some of those future weekend days to be much lower than expected. The weekdays seem more reasonable to me.
-
Ask questions on my twitter or contact me directly. This is my first time doing this so don’t this projection super seriously. Please seek official information for making decisions about your health.
August 14th, 2020 thoughts & takeaways:
-
Traffic volumes fell over the past couple of weeks, speeds are up sharply this week. Will have to look into this further to see if there were some changes at our study intersections.
-
As for those study intersections, I’ve finally included a map of the intersections the traffic volumes come from.
-
At the bottom I’ve included a graphic that I made that summarizes most of the datasets from February to July.
August 1st, 2020 thoughts & takeaways:
-
Things have flattened out since the latest spike in cases. 1.2% decrease last week.
-
I’ve updated the static graphic showing trip types from Google data for Travis County. Check it out!
July 22nd, 2020 thoughts & takeaways:
- Last week we saw a 2.8% increase in volumes. The moving average has recovered back to where we were in the last week of June. The threat of additional lockdowns seem to have been squashed but schools won’t be starting in-person for a while.
July 15th, 2020 thoughts & takeaways:
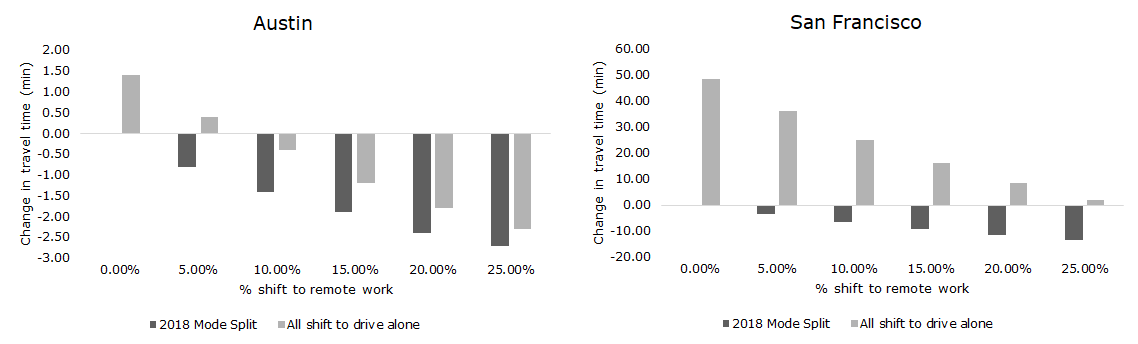
- I’d like to shout out some fantastic modeling work done by Will Barbour and Vanderbilt. They created a “rebound calculator” that estimates travel time impacts based on mode changes due to COVID-19.
- Here’s a plot I created using the tool they included in their post. The big takeaway being that congestion in cities with more transit riders will be impacted much more than car-dependent cities like Austin. I compare a scenario where we kept the same mode split as we did in 2018 versus one where everyone drove alone.
-
My initial thinking was have been that we would actually see improved traffic congestion in a post-COVID world. It’s possible that is what we’ll see in a car-dependent city like Austin but that won’t be the same story in San Francisco or New York. It’s also possible that we could see higher numbers of remote workers, especially if congestion got really much worse. I also didn’t look at job losses, which would have a similar impact as working remotely.
-
Working remotely also generates trips, generally shorter, home-based trips and these aren’t taken into account in more commute-centered modeling like this.
-
One of the biggest riders of transit in Austin are school children. I wonder what the impact on school bus ridership will be.
July 11th, 2020 thoughts & takeaways:
-
Not a whole lot changed over the past week, same trends that we’ve been seeing since the spike in cases began a few weeks ago. US mobility trends from Apple is also seeing a decrease.
-
I’ve added a new section based on some positive feedback I’ve been receiving on the Google post-covid trip reports. That will be updated monthly, for now.
July 6th, 2020 thoughts & takeaways:
-
Over last week, the traffic volume decreased 2.4%.
-
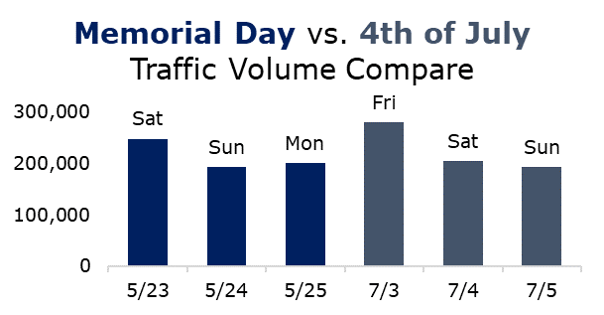
The 4th of July looks more like a regular Sunday and it follows what we saw on Memorial Day. Only about 1% higher than the volume seen on Memorial Day.
-
Since Memorial Day wasn’t particularly great for social distancing and staying at home, I’d say this isn’t great news for keeping cases down.
-
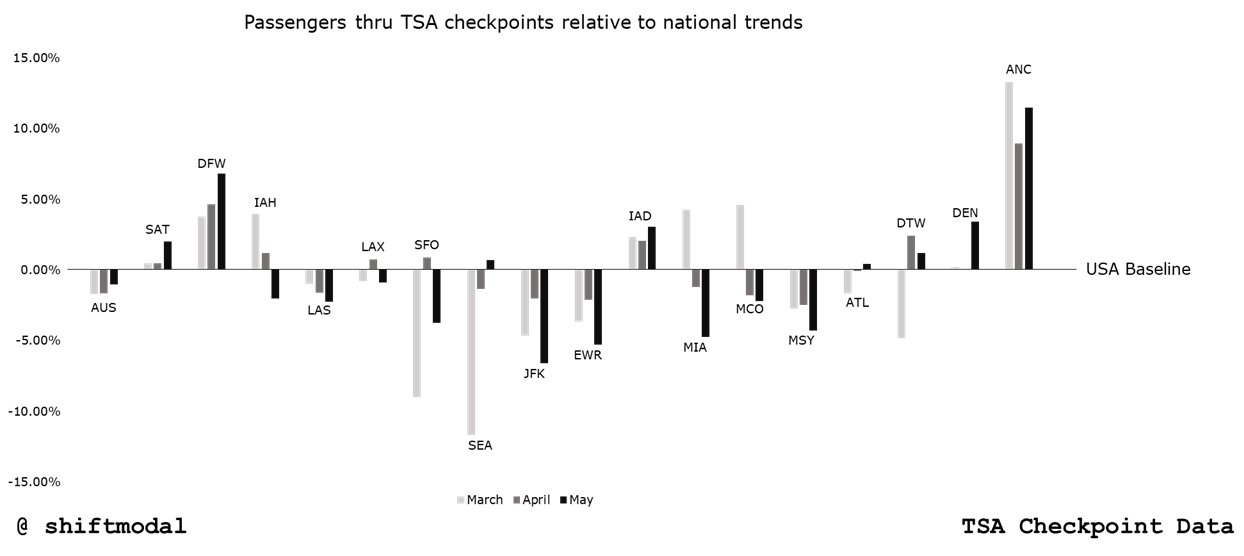
I’ve been diving deep into that TSA data because I thought it was an interesting way to compare when cities locked down and how the virus is spreading. Here’s a chart showing the relative difference in passengers through TSA checkpoints for a few airports I’m interested in:
July 2nd, 2020 thoughts & takeaways:
-
Much the same trends of decreasing traffic have continued, I’ve added a new chart to track the weekly % change in traffic. More lockdown measures have been rumored to be implemented after the long weekend.
-
Here’s a chart showing the change we’ve seen in type of traffic that is returning. Initially, weekend traffic was recovering much faster than the peak hours. This was probably fueled by good weather and cabin fever. In June this went negative as the weather heated up and the virus spread increased.
June 29th, 2020 thoughts & takeaways:
-
The last two weeks have seen decreasing volumes. Last week decreased 6.3%. I guess people are seeing the increasing cases and are deciding to stay home.
-
Sunday’s volume was lower than Father’s day. With the 3-day weekend coming up, we’ll probably see daily volumes continue to drop.
June 26th, 2020 thoughts & takeaways:
-
Austin and Texas isn’t doing so well on the fight against COVID-19. Volumes have started to dip downward, but it may have been caused by poor weather. Father’s day was the lowest daily volume we’ve seen since the end of May.
-
I’ve added some new data from TSA checkpoints. The data is updated every couple weeks. It’ll be interesting to watch if the Austin share of USA traffic will start to nosedive with the increase in cases.
June 20th, 2020 thoughts & takeaways:
-
Daily traffic volumes have returned now to beyond 75-80% of pre-lockdown volumes. About half way recovered from the low point of 50-60% drop in April. Still largely on track for a late August recovery projection. Congestion will follow and we’ve already seen some locations in Austin where congestion is returning.
-
Austin is experiencing a lot of growth in cases, hospitalizations. It’s not clear if people are traveling less or going back into lockdown but businesses certainly aren’t.
-
Daily micromobility trips are now about 15-20% recovered from pre-lockdown numbers. These numbers are very day-of-week dependent. A sizable chunk of weekday trips are UT related, so we may not see these return for a while.
-
Many UT students are seeing that their classes are being moved online. Some students only have one or two in-person classes per week. The effects of this are pretty obvious, but transit is going to be hit hard.
June 11th, 2020 thoughts & takeaways:
-
Traffic volumes increased by 26% in May, but there are obvious reasons why this isn’t the best way to measure the recovery.
-
Another way to show this is that May’s daily traffic volumes were 63% of pre-lockdown February.
-
It’s not completely clear as to why speeds fell two weeks ago. There was some rainy weather Wednesday night. Thursday night (5/28) was the beginning of the protests, but I wouldn’t expect the protests to have an impact on the speeds at the intersections I look at.
-
Black lives matter
May 31st, 2020 thoughts & takeaways:
-
The past week has been eventful, to say the least. Between severe weather and protests average speeds have fallen sharply. Traffic incidents have increased as well.
-
Traffic volumes increased to a new high water mark on Friday. It was the highest volume in a single day since March 14th, the day after schools were closed.
-
Over Memorial Day weekend, shared micromobility daily trip totals broke 1,000 for the first time since March 23rd.
May 27th, 2020 thoughts & takeaways:
-
I’ve changed some of the plots around and changed the intersections I’ve been looking at for the volume & speed plots. A few were locations stopped reporting data over the course of the past month so those were removed.
-
I’ve added a plot that compares Austin traffic vs national trends data from Apple. It sounds like the data comes from people requesting directions in Apple maps, which probably would skew from the normal amount during memorial day weekend. It appears that nationally the traffic has already recovered past the January 13th baseline Apple compares to.
May 23rd, 2020 thoughts & takeaways:
-
Monday, Tuesday, Wednesday, Thursday’s traffic volumes all were very similar. Yesterday only barely higher than the previous Friday which I thought was strange as it was the beginning of the long weekend and with all of the extra businesses that could open. That being said, it was the 2nd busiest day on Austin’s roads since the beginning of the lockdown.
-
Last week I was curious what kind of traffic is actually returning to the roads over the past month of so. Is it people returning to work? People feeling cabin sick and heading outside? I pulled the data and grouped by a few analysis periods. From April 5th to May 2nd, weekend traffic was recovering the fastest, and nearly 4x as fast as the AM peak hour.
May 20th, 2020 thoughts & takeaways:
-
Check out the analysis I did below on travel time and congestion in Austin post-COVID. While traffic volumes have decreased around 40-50%, congestion has reduced 94% and travel times have been reduced by 30%.
-
Volumes have started to bounce back now that weather has returned to being hot and humid.
May 18th, 2020 thoughts & takeaways:
-
Friday night/Saturday morning’s inclement weather caused the highest number of reported traffic incidents since the beginning of the lockdown.
-
The two rainstorms had a pretty major affect on the moving average, causing some data issues at some locations as I mentioned in the last update. As comparing to two weeks ago, only Tuesday and Saturday saw much less volume (-6%, and -2% respectively). I’d expect to see this downward curve start to rebound starting today as the forecast for this week is much better and with the 3-day weekend coming up.
May 15th, 2020 thoughts & takeaways:
-
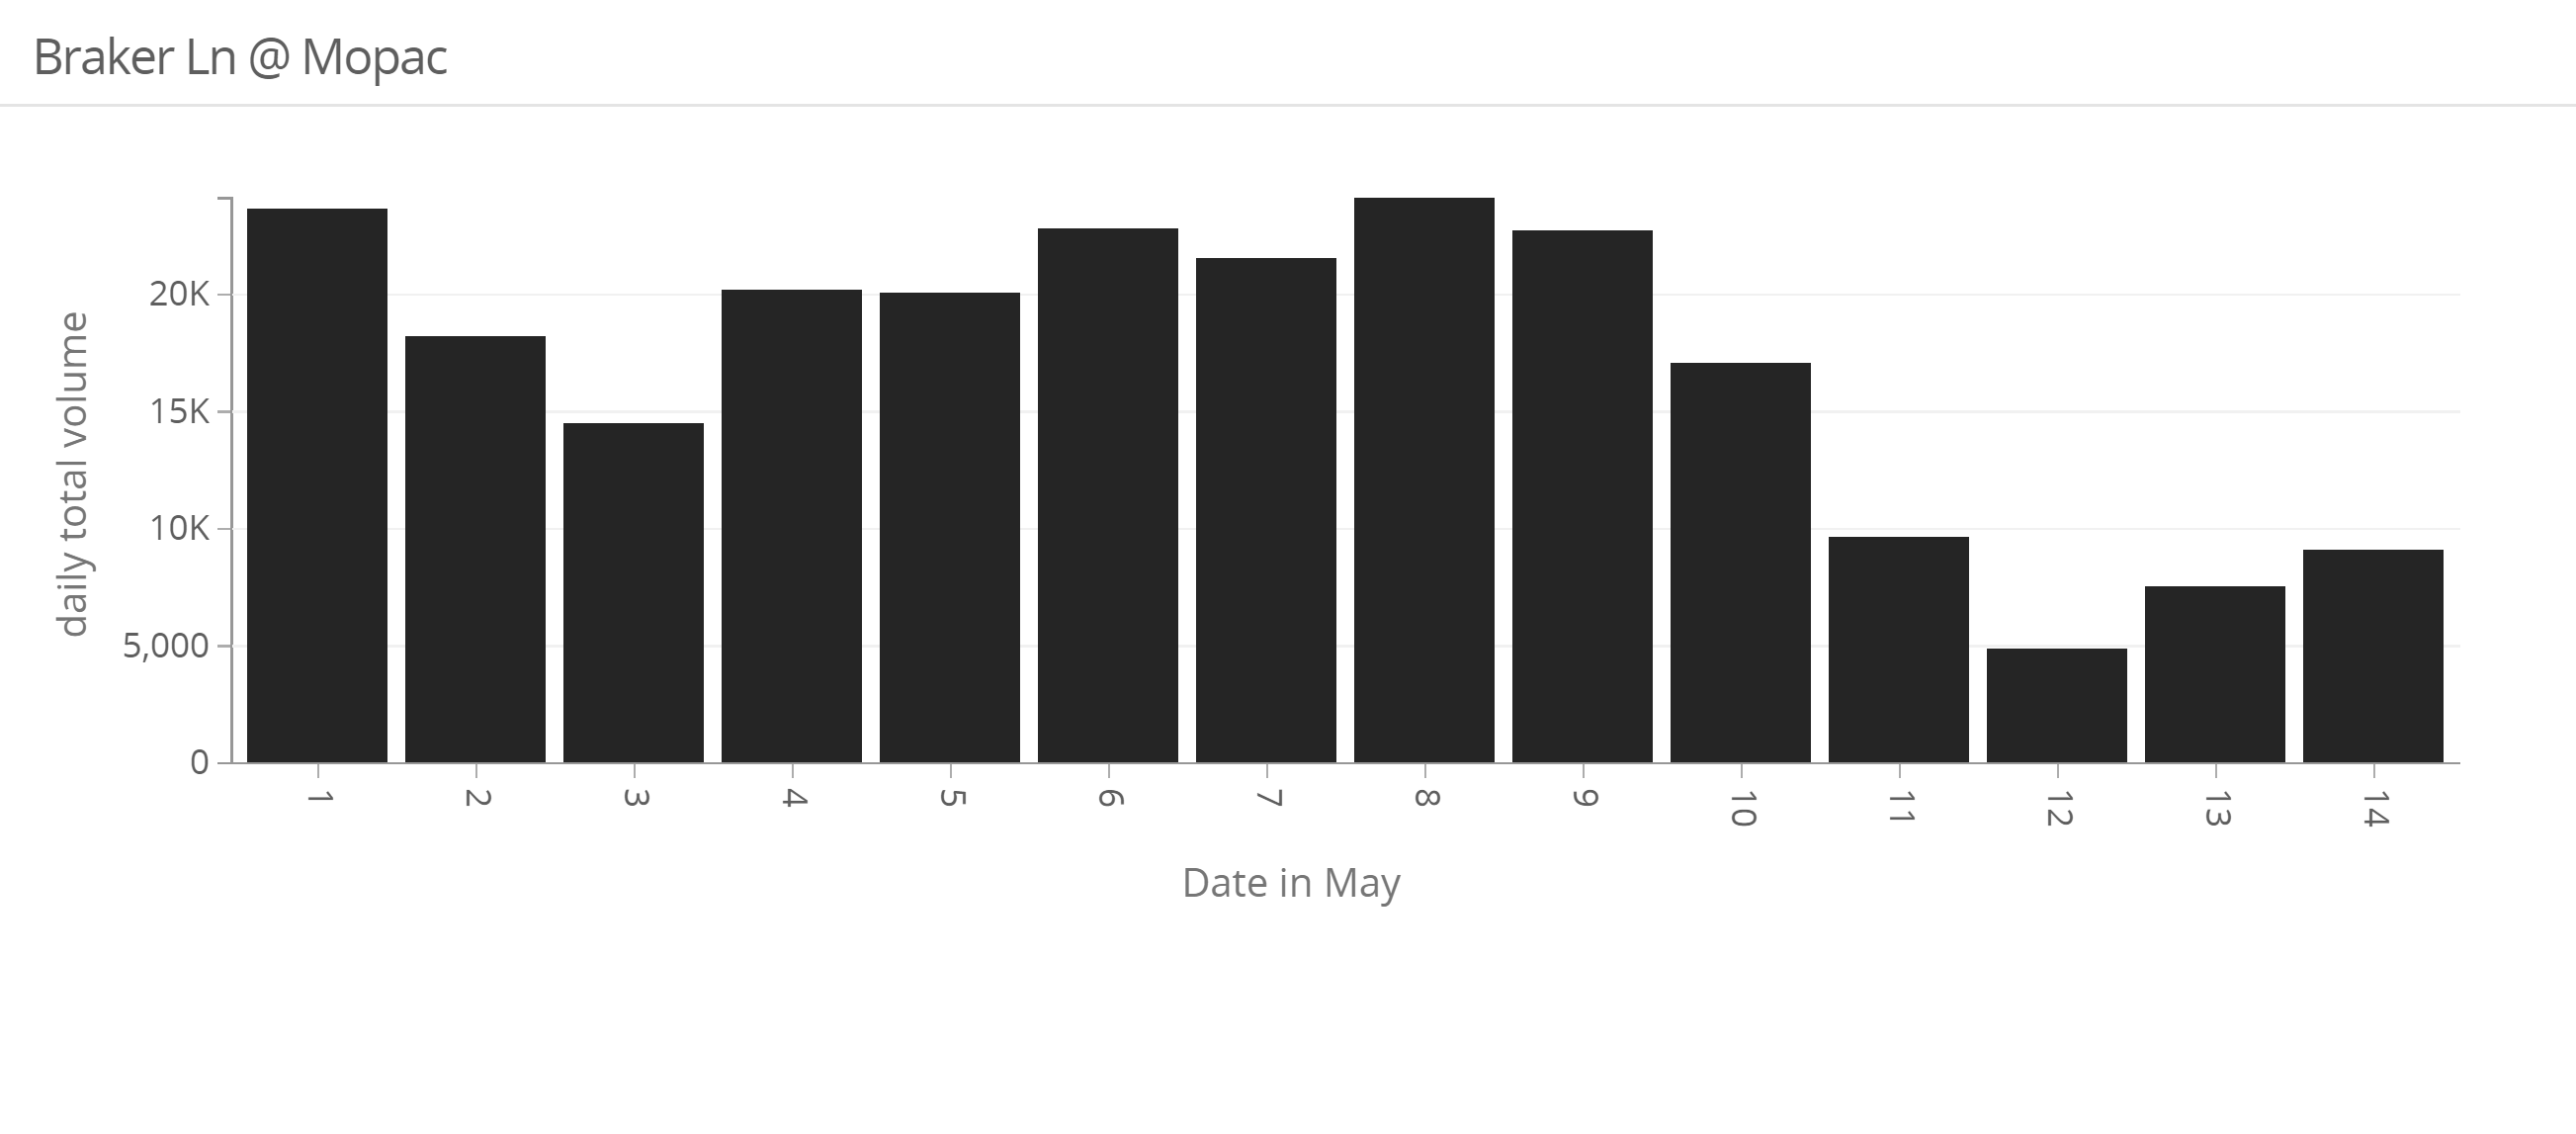
The decreasing trend in the traffic volumes is probably misleading on first glance. First of all, the bad weather on Tuesday reduced traffic volumes significantly. Also, it appears that the weather has caused on data issues at Braker lane/Mopac. That location appears to now only be reporting half of the daily traffic.
-
Inclement weather is forecast for tonight, so this weekend I will take inventory of what count locations I will remove from the dataset to get a more representative sample going forward.
May 13th, 2020 thoughts & takeaways:
-
The huge boost in traffic expected on Mother’s Day didn’t really happen. The volume on Sunday was higher than the previous week but not far from the trend that has been in place over the past two weeks.
-
Yesterday’s volume was the lowest for a Tuesday since April 6th. This was caused by the significant rain we got yesterday. This is also shown in the slower speeds & higher number of traffic incidents.
May 10th, 2020 thoughts & takeaways:
-
The traffic volume recovery rate appears to be slowly increasing. This past week’s growth is about 6% which is higher than the previous rate of about 10% per month.
-
It will be interesting to see Mother’s Day traffic counts as it’ll probably be significantly higher than the previous Sundays, which will have an impact on the moving average. With Memorial Day around the corner as well, who knows what traffic could look like at the end of the month.
-
I’m also curious about what kind of traffic is returning. Is it people commuting to work or people being more willing to do non-essential trips to salons, restaurants, parks, etc? Is it the economy being optimized for the post-Coronavirus world (Uber drivers switching to doordash or something similar)? Expect another post this week where I’ll explore this.
May 6th, 2020 thoughts & takeaways:
-
May 3rd & 4th traffic volume and speed data was missing multiple intersections but now seems to be fixed. The volumes on those days was estimated based on the available data on those days as compared to the previous Sunday/Monday. Sunday saw about 4% higher volumes and Monday was 2% less.
-
The recovery trend is still ticking along at the roughly linear pace since the low point of volumes on the first week of April. The Governor’s new order will open more businesses on Friday and even more in the coming weeks.
-
Sunday’s shared mircomobility trips was the most in a single day since March 19th. Friday’s traffic volumes was the highest for a single day since March 18th.
-
I find it incredibly satisfying that the traffic incidents are following the same curve as traffic volumes.
May 3rd, 2020 thoughts & takeaways:
-
Following the lifting the stay-at-home order for Texas, Friday’s traffic volume was 8% higher than the previous Friday. The same trend remains true for Saturday’s volumes. This was not significantly different than the trend we’ve been seeing over the past two weeks.
-
Some have wondered if we’ll see a “U-shaped” or “V-shaped” recovery from the shutdown. The linear trend following the end of the stay-at-home order bodes well for a Nike swoosh-shaped recovery. If you forecast out this trend line, traffic volumes would recover to the volumes we saw in February around September 1st.
May 1st, 2020 thoughts & takeaways:
-
The Governor’s order to open restaurants and other businesses begins today. Yesterday’s volume data was pretty much on par for what we saw last Thursday. Fridays are usually the highest volume day, since daily rush hour traffic combines with people traveling to locations for the weekend or other leisure activities. We’ll see how this looks in the data tomorrow morning. I’ll be watching the late evening (6-9pm) to see if we’re getting higher volumes of people heading out to eat or whatever.
-
The Austin airport reported a 52% decrease in passenger traffic in March 2020 as compared to March 2019. KLM permanently canceled its new route of Amsterdam-Austin that was scheduled to launch this coming Monday. March 2020 was the least amount of passenger traffic for any 1-month period since February 2014.
April 29th, 2020 thoughts & takeaways:
-
Austin has seen about a 50% in traffic volumes and 10% increase in speeds since the beginning of the lockdown. It’s hard to see if the speed data is at all interesting as the data is collected at signalized intersections. Some increased speeds may be caused by speeding drivers, but it also may be caused by decreased congestion. Something to look into later.
-
Lyft scooters has decided to pull out of Austin permanently. The amount of shared mircomobility trips that we saw before COVID-19 may not return, ever. Many other providers were in shaky finaincal situations before the current crisis.
-
Traffic incident reports are down, but are fatalities or serious injuries down as well? Who knows for now, as the data takes a long time to collect and to be reported. However, higher speed vehicles and more pedestrians & cyclists is generally a bad combination.